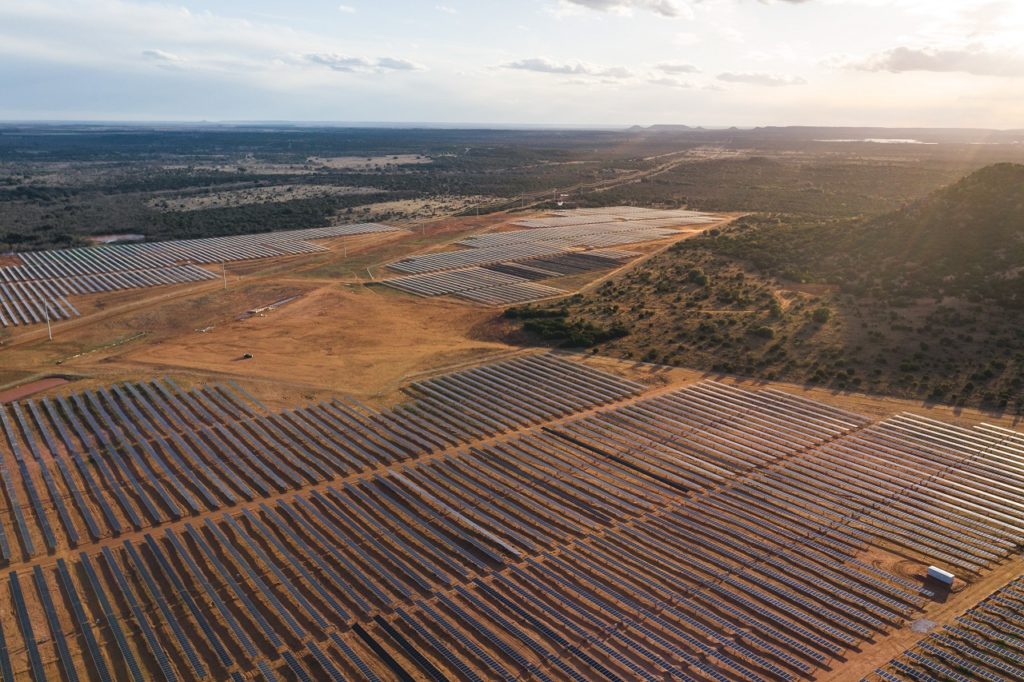
The US installed more than 5GWdc of solar capacity in Q1 2021, taking its cumulative capacity past the 100GW barrier, but supply chain constraints could pose a major barrier to further growth.
That is the key finding from the Q2 Solar Market Insight Report, published today (15 June) by trade body the Solar Energy Industries Association (SEIA) and research firm Wood Mackenzie, which also reveals how Texas installed nearly three-times as much solar than any other US state in the first three months of this year.
Unlock unlimited access for 12 whole months of distinctive global analysis
Photovoltaics International is now included.
- Regular insight and analysis of the industry’s biggest developments
- In-depth interviews with the industry’s leading figures
- Unlimited digital access to the PV Tech Power journal catalogue
- Unlimited digital access to the Photovoltaics International journal catalogue
- Access to more than 1,000 technical papers
- Discounts on Solar Media’s portfolio of events, in-person and virtual
A 46% increase on Q1 2020, and the largest Q1 increase on record, means that solar accounted for 58% of all new power generation capacity added in the US in Q1 2021, the report revealed. Utility-scale solar installed a record 3.6GWdc in Q1 and the report forecasts double-digit year-over-year growth in this sector through 2023.
Moreover, President Biden’s American Jobs Plan, if passed by Congress, will improve the outlook even further for the US solar market. The extension of investment tax credits, production tax credits and incentives to expand the transmission grid are all positives for the industry, the report notes.
But while short-term forecasts look good, there are issues raised in the report regarding supply-side constraints and the impact on the price of raw materials. Increasing demand coupled with supply pressures have led to increased prices and delays, it explains, adding that the industry also faces hurdles from global logistics issues, as well as changes to taxes and labour laws.
While Q1 typically sees a slowdown of installations, this year’s data shows that all sectors apart from community solar grew compared with Q1 2020.
The residential PV market was up 11% from Q1 2020, its largest ever Q1 figure. Wood Mackenzie expects the residential market to grow 19% year-on-year, meaning more than 3.8GWdc installed in 2021, driven by consumer demand and companies addressing last year’s backlog.
An additional 3.63GWdc was installed in the utility sector in Q1, with 6.2GWdc of new contracts signed, bringing the total contracted pipeline to almost 77GWdc. The market is on track to add a record 17.9GWdc of capacity this year. The state of Texas made up the largest share with more than 1.4GWdc installed despite a February winter storm, nearly three-times as much as any other state in the US.
The report has split the former non-residential category into commercial solar and community solar. Commercial solar includes commercial, industrial, agricultural, school, government or nonprofit offtakers, including remotely net-metered projects.
For commercial solar, Q1 installations were at their highest level since 2018 and up 19% on Q1 2020 with 347MWdc installed. While some customer segments are still recovering from insufficient credit options, there has been an increase in environment, social and governance (ESG) investments. Nonetheless, commercial installations are forecast to grow 20% in 2021 compared to last year.
On the other hand, the community sector, where customers can subscribe to a local project, saw installations drop by 15% from Q1 2020. Policy uncertainties, current interconnection and transitioning programmes have resulted in delayed projects. That said, this is not necessarily indicative of a long-term decline and the report has increased the five-year community solar prospect by 16%.

