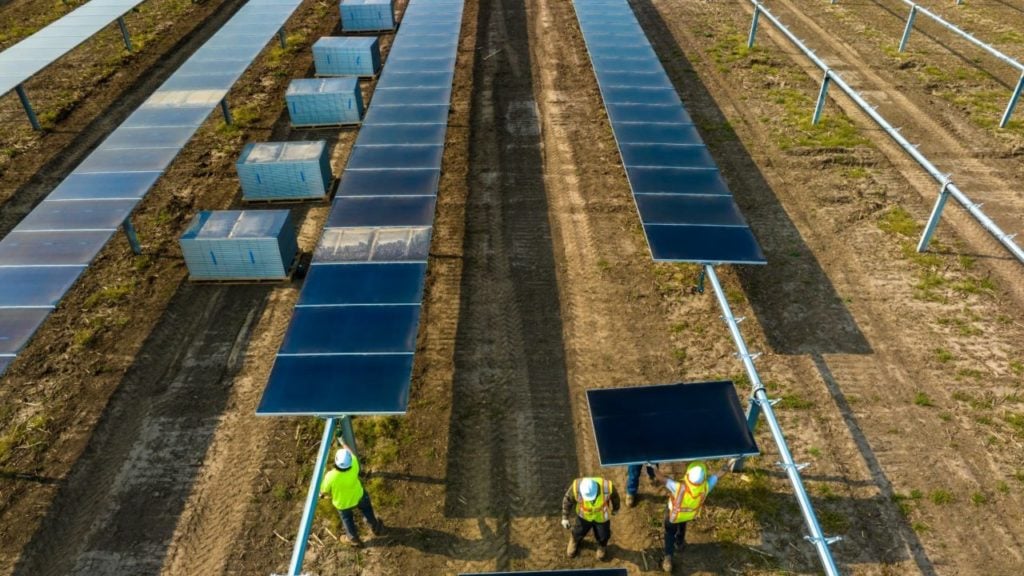
The US Energy Information Administration (EIA) has published its latest figures on the cost of building power plants in the country, which reveal a 6% decline in the average cost of building a new solar facility between 2020 and 2021.
Crucially, much of the fall in costs is associated with a drop in the cost of installing crystalline silicon tracking panels, which make up the majority of installed modules in the US. According to the EIA, the US installed over 6GW of such panels in 2021, equal to 56% of all new utility-scale solar capacity additions to the US grid, compared to around 2GW of fixed-tilt crystalline silicon panels, and around 1GW of all types of cadmium telluride modules.
Try Premium for just $1
- Full premium access for the first month at only $1
- Converts to an annual rate after 30 days unless cancelled
- Cancel anytime during the trial period
Premium Benefits
- Expert industry analysis and interviews
- Digital access to PV Tech Power journal
- Exclusive event discounts
Or get the full Premium subscription right away
Or continue reading this article for free
EIA figures go on to demonstrate that the average cost of crystalline silicon tracking panels was US$1,423/kW, a 10% drop since 2020 and its lowest figure since 2014. As a comparison, the price of fixed-tilt crystalline silicon panels increased 5% to US$2,047/kW, while the cost of cadmium telluride panels fell 1% to US$1,626/kW.
It is worth noting, however, that the figures do not cover the costs of installations in 2022, a tumultuous year for renewable energy supply chains as demand spiked and global supply chains struggled to keep up. Since then, the Inflation Reduction Act was passed by the US government.
A greater emphasis on US manufacturing could lower installation prices in the longer-term, as solar components no longer need to be imported from around the world in such vast quantities; or raise installation prices, as those overseas products deemed integral to the US solar sector are subject to increasingly costly tariffs.
While the average cost of installing a solar project fell in all four regions covered by the EIA data – the north-east, south, west and Midwest – there was considerable geographic variation in cost over the last five years.
Perhaps most notably, the average cost of solar installation increased in the north-east between 2020 and 2021, the only region where this was the case, which could be attributed to growing demand for new solar installations, particularly residential and community projects, allowing developers to charge a higher price for their in-demand services.
This high demand has persisted in more recent years, with the National Renewable Energy Laboratory noting in its Q1 2023 report that in 2022, the north-east accounted for 11% of new capacity installations in the US, more than the 10% accounted for by the state of Florida and the Midwest, despite the larger populations in the latter region.
While high installation costs have not deterred developers from building new projects in the north-east, the imbalance of solar supply and demand in the region raises questions as to the long-term future of the solar sector.
The regional variation demonstrated in the graph above is echoed in the distribution of new solar installations across the US. According to the EIA, the south, where the average installation price was the lowest in 2021, added 7.2GW of new capacity at new plants, while the north-east, where the price was highest, added just 635MW.
As a result of the disparity in costs, however, plants in the south were relatively cost-effective to build. Developers spent US$10.3 billion on new projects, just over five times what was spent in the north-east, but installed more than eleven times as much new capacity as those in the north-east.
This trend is also apparent on a state level. Texas dominated new capacity additions in 2021, adding 3.6GW of new capacity, ahead of Florida and California, which added the second and third-most at 1.2GW each, and this was done in a relatively cost-effective manner.
The average price of solar installation in Texas was US$1,367/kW, well below the national average of US$1,908.5/kW and the price of installing a solar system in California, which reached US$1.640/kW. These encouraging figures echo the sentiment of other EIA data, which demonstrates that solar capacity in the US is growing at a replicable and sustainable rate.
The strong performance of the price of solar installations compares favourably with an 18% fall in the price of building a new natural gas plant, and a 5% drop in the cost of building a new wind farm, over the same period.
Collectively, these forms of energy generation made up more than 91% of the new capacity added to the US electric grid in 2021, and investments in new electricity generation increased by 10% between 2020 and 2021 to US$50.8 billion, demonstrating that the US is willing, and able, to invest considerably in domestic energy generation.


