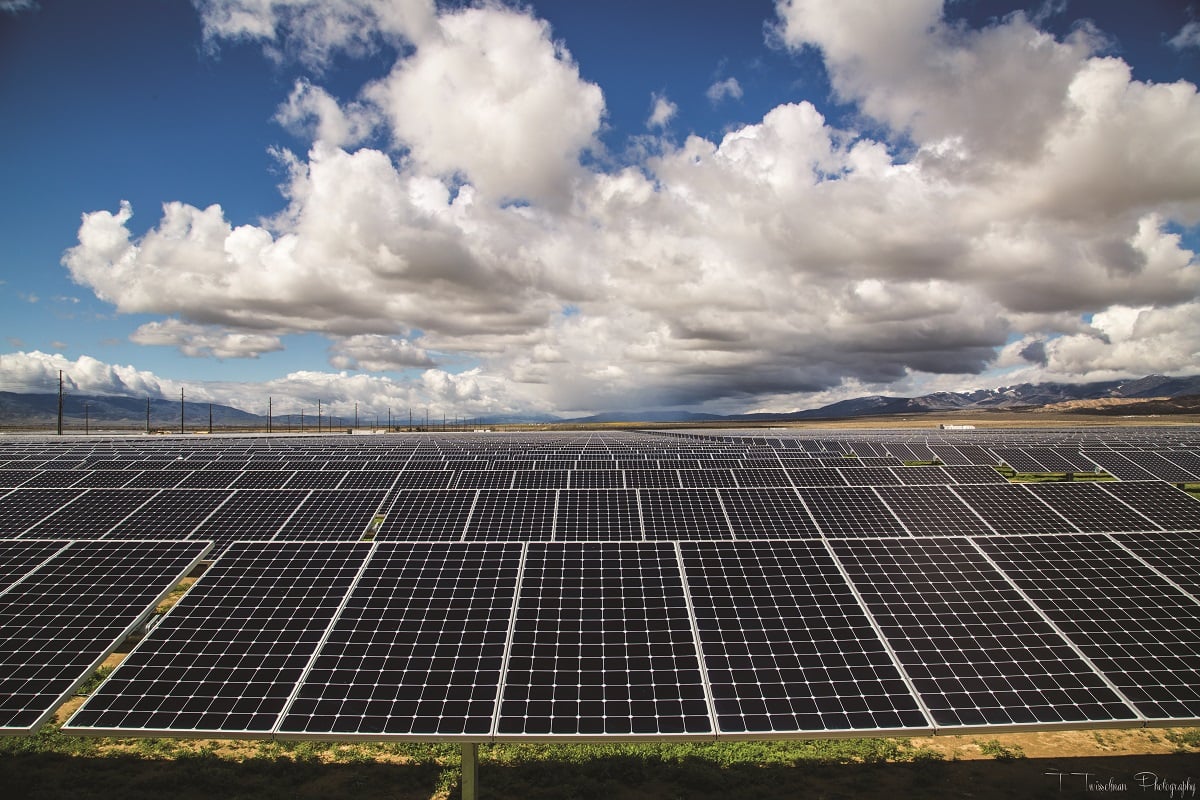
Only a little more than a dozen years old, the utility-scale PV sector in the United States has grown rapidly. Just five years after the first two utility-scale projects achieved commercial operations in late 2007, the utility-scale sector became the largest segment of the overall US PV market (in terms of new capacity) in 2012, and has since shown no signs of relinquishing its market-leading position. In 2018, the utility-scale sector accounted for nearly 60% of all new PV capacity built in the United States, and more than three quarters of all states were home to one or more utility-scale PV projects (defined here as any ground-mounted project larger than 5 MWAC).
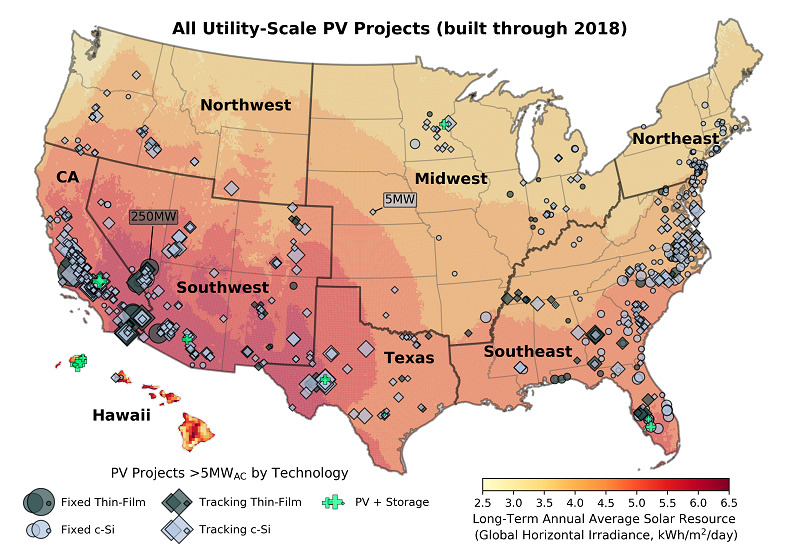
Figure 1 plots the 690 utility-scale PV (and in some cases, PV plus battery) projects totaling 24,586 MWAC that were operating in the United States at the end of 2018 by location and technology configuration. While the sector got its start in sunny southwestern states like Nevada, Arizona, and California, declining installed costs have enabled it to expand to less-sunny regions of the country—even recently including northerly states like Washington, Minnesota, Michigan, and Vermont. Some of these more-recent northerly projects are even using single-axis tracking, which in earlier days had been reserved primarily for the sunniest sites (i.e., where the solar resource was strong enough to justify tracking it).
Try Premium for just $1
- Full premium access for the first month at only $1
- Converts to an annual rate after 30 days unless cancelled
- Cancel anytime during the trial period
Premium Benefits
- Expert industry analysis and interviews
- Digital access to PV Tech Power journal
- Exclusive event discounts
Or get the full Premium subscription right away
Or continue reading this article for free
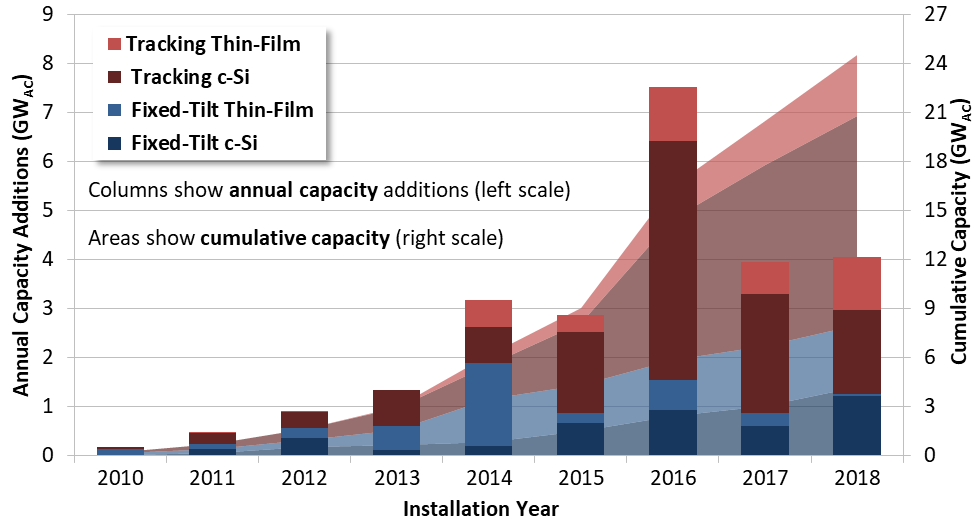
Since 2015, though, single-axis tracking has become the dominant mount type in most parts of the country, and was used for nearly 70% of all new capacity—including virtually all new thin-film (primarily CdTe, but with some CIGS) capacity—added in 2018 (Figure 2). Fixed-tilt projects are increasingly only built in less-sunny regions, even while tracking projects continue to push into those same regions.
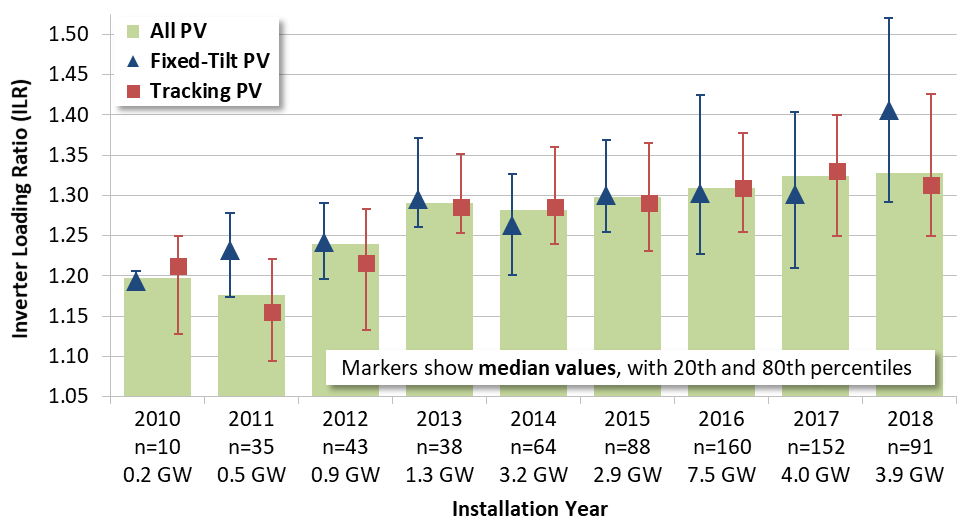
Meanwhile, the median inverter loading ratio (“ILR”)—i.e., the ratio of the DC capacity of a project’s PV array relative to the AC capacity of its inverters—has risen steadily, from around 1.2 in the early days of the sector to more than 1.3 in 2018 for both tracking and fixed-tilt projects (Figure 3). Higher ILRs allow inverters to operate closer to (or at) full capacity for more of the day, but as the DC:AC ratio increases, the extra generation during the morning and evening “shoulder hours” must be balanced against any mid-day power clipping that occurs to ensure that there is a net gain in production. For a standalone PV project, an ILR in the range of 1.3-1.4 seems to be the sweet spot, but this ratio could go significantly higher (e.g., to 2.0 or more) with the addition of a DC-coupled battery that is able to capture and store mid-day solar generation that would otherwise be clipped.
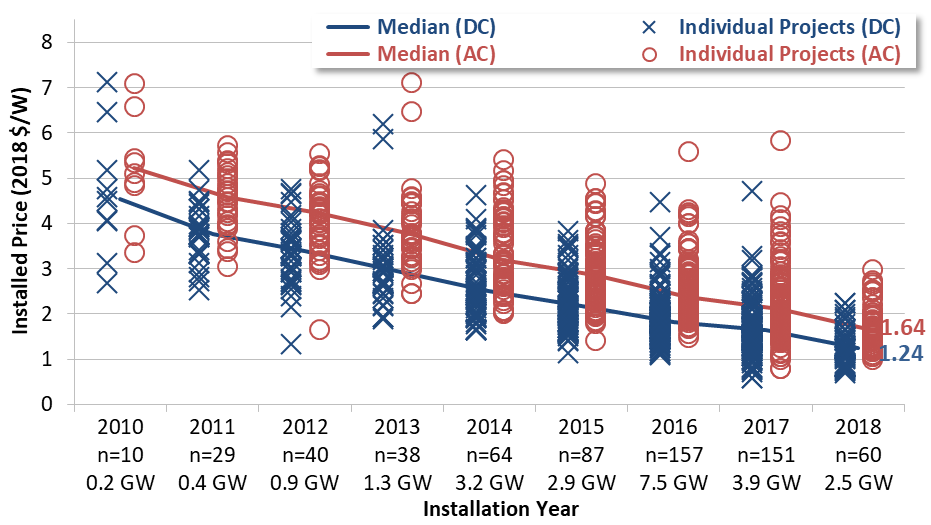
Median installed prices have steadily fallen by nearly 70% since 2010, to US$1.6/WAC (US$1.2/WDC) among 60 utility-scale projects (totaling 2.5 GWAC) completed in 2018 (Figure 4). In a sign of a maturing market, price dispersion across the sample has narrowed in each year since 2013—e.g., the standard deviation of installed prices declined from US$0.9/WAC in 2013 to US$0.5/WAC in 2018.
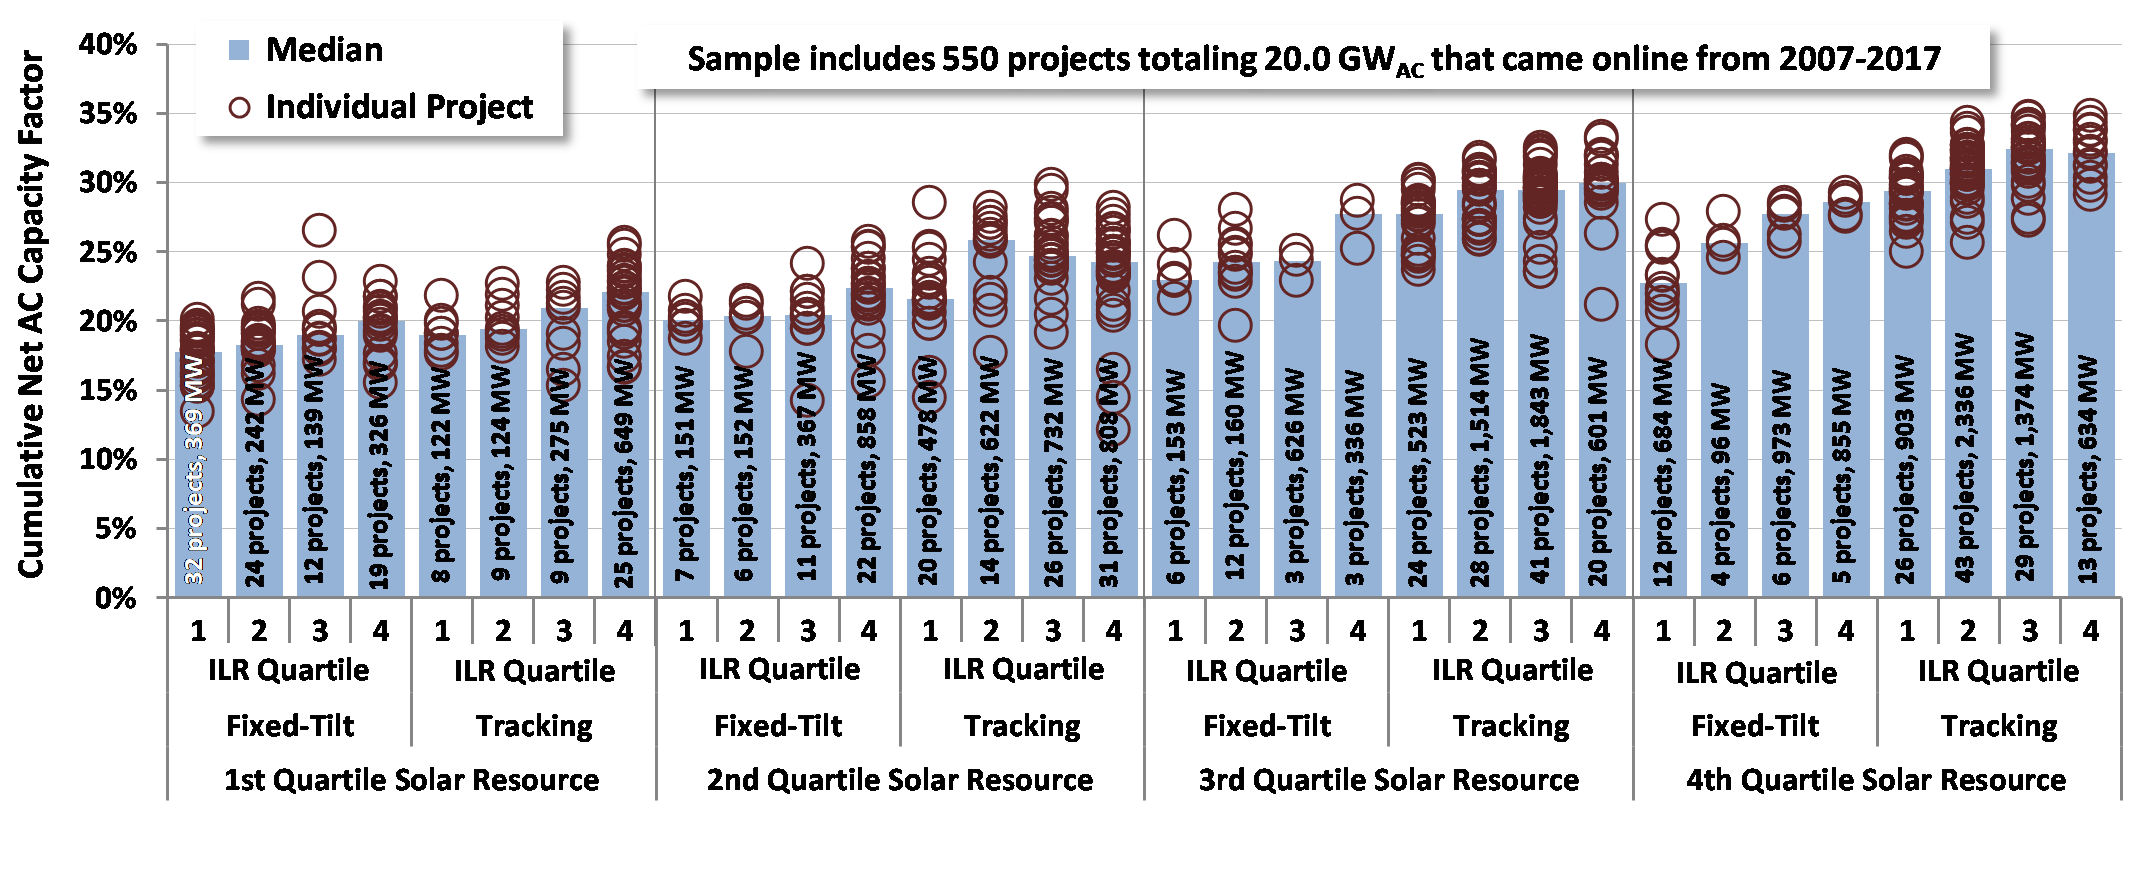
To assess how these projects have performed, we rely on capacity factors—a measure of the amount of electricity generated in a given period relative to how much electricity could have been generated if the generator was operating at full capacity for the entire period. Because solar generation varies seasonally, capacity factor calculations for solar are typically performed in full-year increments. Figure 5 shows that the capacity factors of individual projects in our sample vary widely, from 12% to 35% (in AC terms), with a sample median of 25% and a capacity-weighted average of 27%. A good deal of this project-level variation can be explained by the three primary drivers of capacity factor that are tracked in Figure 5: the average quality of the solar resource at the site (broken out into quartiles), whether the project tracks the sun or is mounted at a fixed-tilt, and the ILR (also divided into quartiles). Curtailment and degradation—both of which are baked into the capacity factors shown in Figure 5—can also play a role, and may be partly responsible for some of the apparent outliers.
This is an extract of an article first published in Volume 22 of PV Tech Power. The full article can be read here, or in the full digital copy of PV Tech Power 22, which can be downloaded for free here.


