Australia’s utility-scale solar PV and wind assets delivered a combined 5TWh of generation in February 2026, marking an 11% increase from the 4.5TWh recorded in the same month last year.
According to David Dixon, a senior analyst at Rystad Energy, Western Australia emerged as a standout performer for wind generation, while utility solar assets demonstrated strong performance across multiple states.
Try Premium for just $1
- Full premium access for the first month at only $1
- Converts to an annual rate after 30 days unless cancelled
- Cancel anytime during the trial period
Premium Benefits
- Expert industry analysis and interviews
- Digital access to PV Tech Power journal
- Exclusive event discounts
Or get the full Premium subscription right away
Or continue reading this article for free
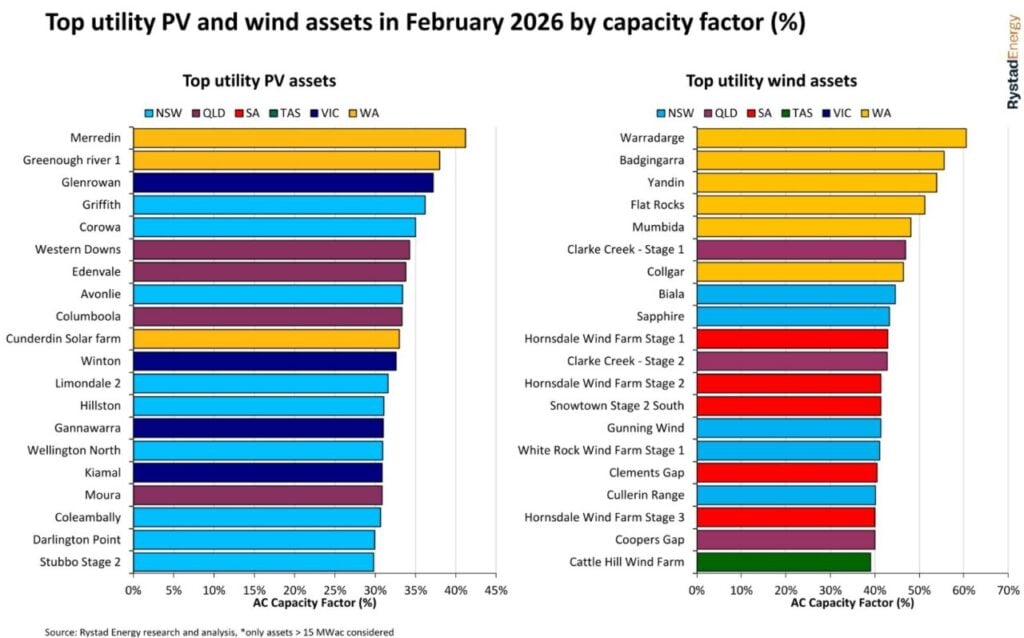
For instance, utility-scale solar PV assets demonstrated strong performance across New South Wales, Victoria and Western Australia during February.
Sun Energy’s Merredin Solar Farm in Western Australia led the utility PV rankings with 41.2% AC capacity factor, followed by Potentia Energy and Synergy’s Greenough River Solar Farm, also in Western Australia, at 38% AC capacity factor.
CIMIC Group’s Glenrowan Solar Farm in Victoria ranked third with a 37.2% AC capacity factor.
The distributed performance across multiple states reflects the maturing utility-scale solar sector’s geographic diversification, helping to mitigate some of the challenges from curtailment, which exceeded 7TWh in 2025 across the National Electricity Market (NEM).
The month also witnessed significant market consolidation, with Aula Energy becoming the second-largest owner of operational utility-scale solar capacity in Australia following its acquisition of Lightsource bp’s operating solar PV power plants.
The February figures come as Australia’s NEM continues to experience significant structural changes, with pricing volatility reaching new extremes while renewable energy sources increasingly dominate the generation mix. You can find out more in our recent NEM Data Spotlight for February 2026 (Premium access).
The month’s performance builds on the historic achievement of clean energy overtaking coal, as Australia’s NEM delivered a record 51% of renewables.
Western Australia claimed all three top positions for wind asset performance in February, with Potentia Energy and Synergy’s Warradarge Wind Farm leading the field at 60.5% capacity factor. APA Group’s Badgingarra Wind Farm followed with 55.6% capacity factor, while Alinta Energy and RATCH-Australia’s Yandin Wind Farm rounded out the top three at 53.9% capacity factor.
The strong Western Australian performance contributed to February 2026 setting new monthly wind generation records across all states except Tasmania and Victoria.
At the state level, New South Wales claimed the top spot for combined utility solar and wind generation, delivering 1,470GWh comprising 617GWh from wind and 853GWh from utility PV assets.
February’s renewable energy milestone coincided with continued structural changes in Australia’s electricity generation mix.
NEM gas generation declined to 506GWh during the month, while battery discharge surged to 245GWh, a 266% increase from the 67GWh recorded in February 2025.
The battery storage expansion reflects the ongoing deployment of utility-scale storage capacity, with 8.2GW now at various stages of commissioning or operation across the market.
This rapid growth in storage capacity is helping to address grid stability challenges while supporting higher levels of renewable energy penetration.
Despite the renewable energy surge, coal generation maintained significant output during February, with Bluewaters Power Station in Western Australia achieving the highest capacity factor at 96.6%.
CS Energy’s Kogan Creek Power Station followed at 87.4% capacity factor, while Alinta Energy’s Loy Yang B Power Station in Victoria recorded 87% capacity factor.


