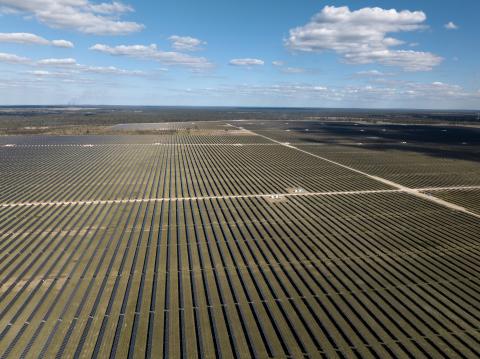
Australia’s utility-scale solar PV and wind assets generated a combined 4.7TWh in March 2026, representing a 2% increase from the 4.6TWh recorded in the same month last year, according to data from Rystad Energy senior analyst David Dixon.
The modest growth follows February’s more robust 11% year-on-year increase, which saw combined generation reach 5TWh, suggesting a seasonal moderation as Australia transitions from summer into autumn.
Try Premium for just $1
- Full premium access for the first month at only $1
- Converts to an annual rate after 30 days unless cancelled
- Cancel anytime during the trial period
Premium Benefits
- Expert industry analysis and interviews
- Digital access to PV Tech Power journal
- Exclusive event discounts
Or get the full Premium subscription right away
Or continue reading this article for free
The March figures reveal a geographic divergence in performance, with Queensland and Western Australia dominating the top-performer rankings, while the southern states experienced notably subdued conditions.
For utility-scale solar PV, the best-performing assets, in terms of AC capacity factor, were concentrated entirely in Queensland and Western Australia.
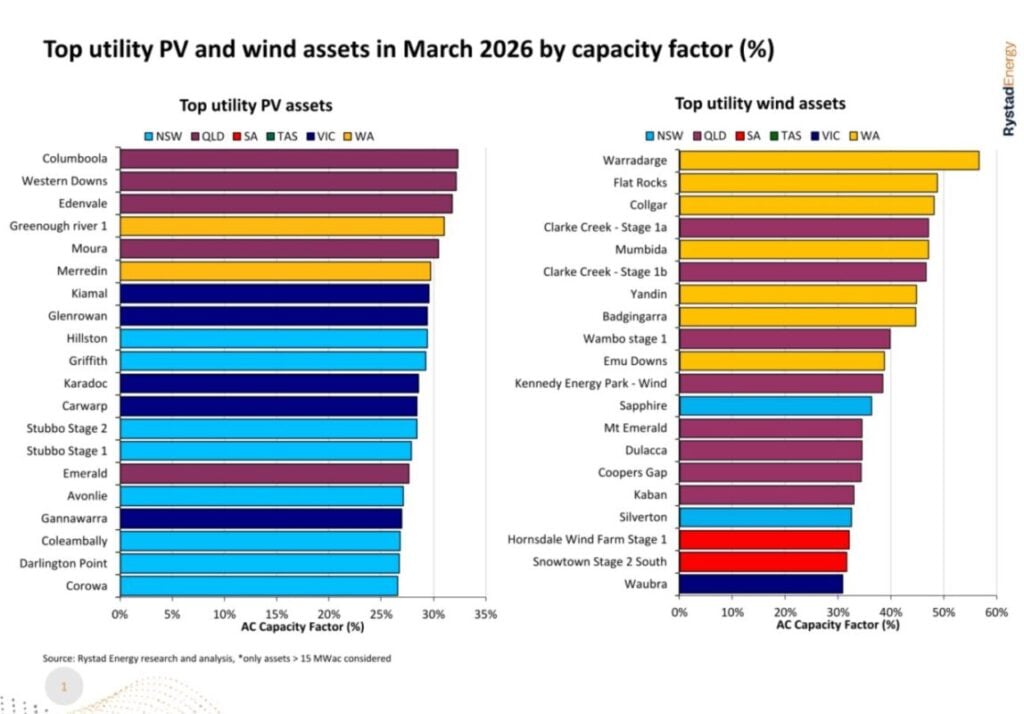
Hana Financial Investment’s Columboola solar PV power plant led the rankings with an AC capacity factor of 32.4%, followed by Neoen’s Western Downs at 32.2% and ENEOS Group and Sojitz Corporation’s Edenvale at 31.8%.
These capacity factors represent a significant decline from February’s leaders, when Sun Energy’s Merredin Solar Farm achieved an AC capacity factor of 41.2%, showcasing the seasonal reduction in solar irradiance as summer wanes.
The geographic concentration of top performers stands in stark contrast to the distributed performance seen across multiple states in February, when utility-scale solar assets demonstrated strong results across New South Wales, Victoria and Western Australia.
Queensland emerged as the standout state for combined utility solar and wind generation, delivering 1,300GWh comprising 676GWh from utility PV and 624GWh from wind.
You can find out more about solar PV generation across the NEM in our latest NEM Data Spotlight for March 2026 (Premium access).
Wind generation shows regional divergence
The top-performing wind assets were also concentrated in Queensland and Western Australia, with Potentia Energy and Synergy’s Warradarge Wind Farm leading at 56.7% capacity factor.
Potentia Energy’s Flat Rocks Wind Farm followed with 48.8%, while Rest’s Collgar Wind Farm rounded out the top three at 48.3%.
These figures contrast sharply with February’s performance, when Warradarge achieved a 60.5% capacity factor, reflecting seasonal variations in the wind resource.
Queensland achieved a historic milestone in March, recording its highest wind generation and becoming the second-highest wind-generating state on a monthly basis for the first time.
Southern states experienced particularly challenging wind conditions during March, with capacity factors below 24% in New South Wales, South Australia, Tasmania and Victoria.
Victoria recorded an especially poor result, with a capacity factor of just 18.6%, marking the third-lowest month since 2011.
Market transformation accelerates
Beyond generation performance, March witnessed several significant developments signalling the ongoing transformation of Australia’s electricity sector.
NEM gas generation continued its year-on-year decline, reaching approximately 540GWh compared to 631GWh in March 2025, as utility batteries and renewables continue entering the market.
Utility battery storage capacity now stands at 8.9GW at various stages of commissioning or operation, with battery systems now consistently dispatching more energy than the open-cycle gas turbine fleet, Dixon noted.
The displacement of gas generation by battery storage and renewables is expected to intensify during winter months, when batteries can charge during the day from coal and renewable energy to displace gas during evening peaks.
Operational demand remained relatively subdued in March at approximately 20.7GW, with only March 2020 and 2021 recording lower figures since 2011.
The March performance data arrives as Australia’s renewable energy sector continues navigating the transition from standalone solar installations to hybrid configurations incorporating battery storage, a shift driven by both grid integration requirements and the economic imperative to maximise asset utilisation amid growing curtailment challenges.


