Australia’s solar and energy storage sectors delivered strong performance during the third quarter of 2025, with grid-scale solar generation reaching 1,699MW average output while battery storage systems expanded capacity by 2,936MW since Q3 2024.
The Australian Energy Market Operator’s (AEMO) latest Quarterly Energy Dynamics report reveals how these technologies reshaped the National Electricity Market (NEM), driving renewable energy share to 42.7% and establishing new benchmarks for grid integration and market dynamics.
Try Premium for just $1
- Full premium access for the first month at only $1
- Converts to an annual rate after 30 days unless cancelled
- Cancel anytime during the trial period
Premium Benefits
- Expert industry analysis and interviews
- Digital access to PV Tech Power journal
- Exclusive event discounts
Or get the full Premium subscription right away
Or continue reading this article for free
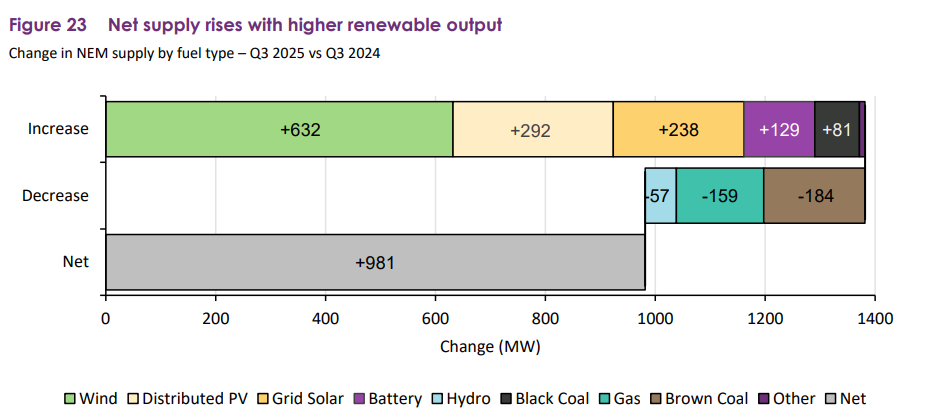
Grid-scale solar generation increased 16% year-on-year during Q3 2025, establishing a new record for any third quarter period. The 238MW net generation increase resulted from 289MW of new capacity additions, 24MW from commissioning facilities, and 18MW from improvements to the existing fleet.
Economic offloading reduced potential output by 90MW while curtailment accounted for 4MW of lost generation, demonstrating the growing need for storage solutions to capture excess solar production during peak generation periods.
New South Wales led solar capacity expansion with 140MW of additional generation, followed by Victoria with 71MW and Queensland with 27MW. South Australia recorded a marginal decline of 1.6% in solar output.
The geographic distribution of growth reflects transmission infrastructure capacity and grid connection opportunities across the eastern seaboard, with established solar regions continuing to attract investment. At the same time, emerging markets develop their renewable energy portfolios.
Volume-weighted available capacity factors for established grid-scale solar facilities remained consistent with those of the previous year. Queensland achieved the highest average capacity factor at 25.3%, representing a 1.3 percentage point increase from the third quarter of 2024.
Victoria recorded the most substantial improvement with a 2.3 percentage point rise to 19.4%, while New South Wales declined 1.5 percentage points to 18.0% and South Australia decreased marginally to 20.9%.
The distributed solar segment continued to expand, with NEM-wide distributed photovoltaic output increasing by 292MW to reach a new Q3 record.
This growth contributed to minimum demand records across multiple regions, with the NEM recording a minimum demand of 10,175MW, New South Wales reaching 3,265MW, Queensland achieving 2,790MW, and South Australia recording a negative minimum demand of 14MW.
These minimum demand levels underscore the growing presence of behind-the-meter solar installations and their influence on traditional demand patterns.
Battery energy storage deployment surges 150% year-on-year
Battery storage deployment accelerated during Q3 2025, with 2,936MW of new capacity and 6,482MWh of energy storage entering the NEM since the end of Q3 2024. Battery discharge averaged 215MW throughout the quarter, representing a 150% increase from the previous year.
The expansion fundamentally altered grid operations, with battery systems providing essential support during evening peak demand periods when solar generation declines and traditional demand patterns create supply challenges.
Battery discharge increased by 463MW year-over-year during evening peak hours between 1,600 and 2,000, representing a 177% growth that addressed grid stability requirements.
This additional battery output reduced dispatch requirements for gas-fired generation by 11% and hydro output by 3.5% during high-demand periods, demonstrating how energy storage displaces higher-cost generation sources while providing superior grid response capabilities.
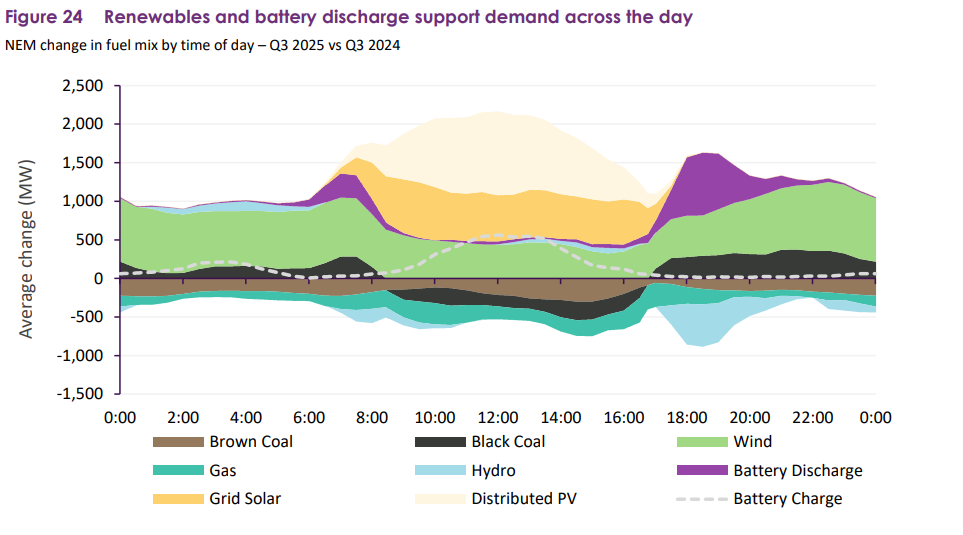
AEMO states that these battery systems demonstrated sophisticated operational strategies through their state of charge (SoC) patterns, peaking in late afternoon before discharging during evening hours. This behaviour aligns with grid requirements and reflects the technology’s ability to provide predictable, dispatchable capacity when needed most.
The operational data suggests battery systems are being deployed to maximise both grid benefits and commercial returns, with charging occurring during periods of renewable energy abundance and discharging when demand peaks.
The integration of solar and storage technologies created complex market dynamics that revealed both opportunities and challenges for grid operators. Queensland recorded the lowest quarterly average spot price across the NEM at AU$72/MWh (US$47.21/MWh), with a record 25.9% of dispatch intervals experiencing negative or zero prices.
This pricing pattern reflects the abundance of renewable energy generation during specific periods, when solar output peaks during midday hours and storage systems provide additional flexibility.
Economic offloading of solar generation increased from 237MW in Q3 2024 to 327MW in Q3 2025, rising from 14% of average solar availability to 16%. Queensland experienced the most substantial increase, with 92MW of additional offloading, reaching more than 25% of available grid-scale solar output, as daytime negative price occurrences grew by 13 percentage points to 66%. The data indicates opportunities for developers to optimise project designs by incorporating storage components that can capture otherwise curtailed generation.
Network curtailment of solar generation increased marginally from 60MW in Q3 2024 to 64MW in Q3 2025, while as a share of average solar availability, it declined 0.3 percentage points to 3.1%.
Wind curtailment increased more substantially from 47MW to 78MW, with most of the 31MW increase occurring in Victoria and South Australia. The divergence between solar and wind curtailment patterns suggests different grid integration challenges for each technology.
Battery systems demonstrated exceptional value capture beyond energy arbitrage, with their role in price-setting dynamics becoming increasingly prominent. Battery discharge set marginal prices in 9% of intervals during Q3 2025, up four percentage points from the previous year, while battery charge influenced price-setting in 9% of intervals, representing a similar increase.
The average price when battery discharge was marginal reached AU$185/MWh, although this represented a decrease of AU$314/MWh from Q3 2024, reflecting an overall reduction in price volatility.
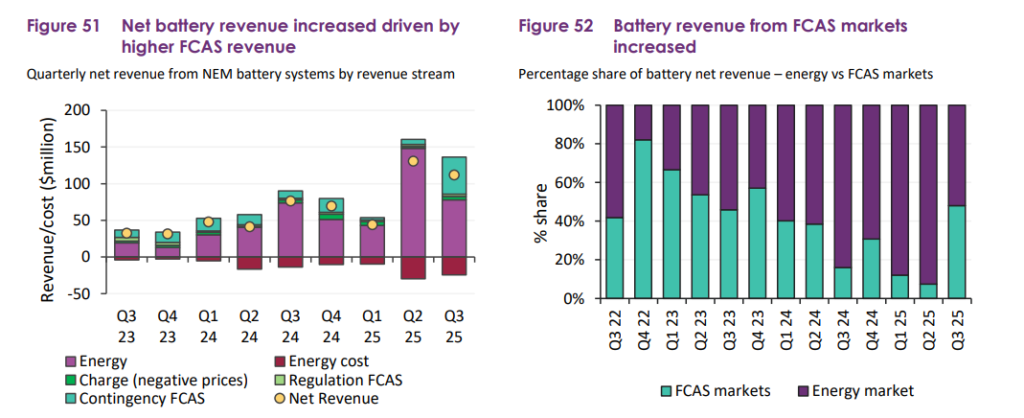
Revenue diversification strengthened the business case for battery investments, with net battery revenue increasing, driven by higher revenue from frequency control ancillary services.
Battery energy storage systems (BESS) dominated the Frequency Control Ancillary Services (FCAS) market share in certain regions, accounting for 77% of the contingency and regulation market volume in Q3 2025.
Renewables and energy storage reduce wholesale spot price averages
Wholesale electricity pricing reflected the stabilising influence of increased storage capacity and renewable energy generation. Wholesale spot prices averaged AU$87 per MWh across all NEM regions, representing a 27% decrease from Q3 2024 and a 38% reduction from Q2 2025.
Price volatility, measured by spot prices exceeding AU$300/MWh, decreased across all regions, adding just $6/MWh to the NEM quarterly average compared to AU$31/MWh in the previous year – an 82% reduction that demonstrates the stabilising effect of increased storage capacity.
Volume-weighted average prices across NEM regions ranged from AU$80/MWh in Queensland to AU$124/MWh in South Australia, representing reductions of 22% to 38% compared to Q3 2024.
These price reductions, facilitated by increased renewable energy generation and storage flexibility, translate to cost savings for electricity consumers while maintaining system reliability.
The operational data from Q3 2025 reveals how solar and storage technologies are reshaping Australia’s electricity market through improved grid stability, reduced emissions, and enhanced economic efficiency.
Total emissions fell to 28.1 million tonnes of carbon dioxide equivalent, down 1.2% from Q3 2024, while emissions intensity averaged 0.57 tonnes of carbon dioxide equivalent per MWh, representing a record low and a 4.4% improvement year-on-year.
Connection pipeline data indicates continued growth momentum, with strong registration activity and steady applications for new solar and storage projects. Increased capacity progressed through application, proponent implementation, and commissioning stages throughout the year, suggesting sustained development activity across multiple project phases.
The Q3 2025 performance establishes solar and storage technologies as fundamental components of Australia’s electricity system transformation.
The combination of record deployment levels, sophisticated operational integration, and favourable market outcomes demonstrates these technologies are delivering on their promise to enable higher renewable energy penetration while maintaining grid reliability and economic efficiency.


")
