
This article introduces a new methodology that allows leading PV module producers to be categorized by manufacturing and financial strength metrics, ultimately providing an investor-risk (or bankability) profile for non-residential end-market selection.
This is the first of six articles on PV-Tech.org that will provide full transparency on the methodology used to assign investment risk to PV module suppliers selling to commercial, industrial and utility segments of the energy industry.
Try Premium for just $1
- Full premium access for the first month at only $1
- Converts to an annual rate after 30 days unless cancelled
- Cancel anytime during the trial period
Premium Benefits
- Expert industry analysis and interviews
- Digital access to PV Tech Power journal
- Exclusive event discounts
Or get the full Premium subscription right away
Or continue reading this article for free
The output from the analysis – undertaken by the PV-Tech research team over the past five years – will form a key part of my opening talk at the forthcoming PV ModuleTech 2019 conference in Penang, Malaysia on 22-23 October 2019.
Summary of the investment-risk methodology used
Investment-risk (or bankability) scores for all PV module manufacturers are obtained by combining manufacturing and financial health scores, through nonlinear/power regression analysis. The data used is dominated by quantitative inputs (six years back and two years forward in the case of forecasted variables), with qualitative data kept to a minimum. At each stage of the analysis, comparison is made with how the module makers have been perceived in the market from a bankability/investment perspective.
The basic relationship between module supplier bankability (B), manufacturing (M) and financial (F) scores will be shown during the series of articles to follow the nonlinear relationship:
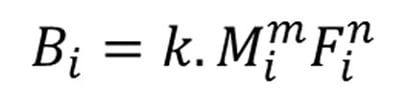
where k is a scaling factor that maps bankability scores to a 0-10 band, m and n are power coefficients derived from regression analysis, and i is a variable that is module-supplier and time-period specific.
The manufacturing health score, M, for any individual module supplier, at any given time (quarter, year-end, etc.) is determined through gathering a wealth of data for all module suppliers, annually back to 2013 and by quarter back to Q1’15, and analysing the dependency of this data on overall company-specific manufacturing status within the industry at any given time period.
The full series of articles will explain this in detail. The manufacturing score, M, will be shown to be a combination of module supply (shipment), capacity, and technology ratios. The manufacturing score, M, will be shown to be derived by the relationship:
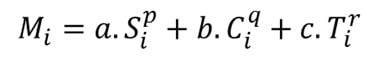
where a, b, and c are factor-dependent weightings, scaled to generate manufacturing health scores for each company by quarter (i) in a 0-10 band; S, C and T are the module supplier shipment, capacity and technology ratios introduced above; p, q and r represent power factors derived from regression analysis.
The above relationship is therefore a linear combination of nonlinear/power terms, with the presumption that the three terms S, C and T independently affect the dependent M values. Over the course of the articles, I will discuss the dependency of factors used to establish final module supplier bankability ratings, as this is not simple by any means. However, I will show that certain parameters dominate company-specific metrics (in particular, when calculating the manufacturing health metric and the final bankability metric), minimizing the impact of other inputs (for example, R&D spending, that may be valuable to track in other adjacent technology sectors, but for PV and module bankability has limited bearing).
This article focuses on the manufacturing supply score (S) and how this is derived. Following articles will cover the other manufacturing score factors (C and T), the overall manufacturing health score (M), before finally I address the financial analysis (F) and the overall bankability scores (B). The bankability scores form the basis of investment risk grades that will be of great value to investors looking to short-list and compare different module suppliers and technologies for large-scale site selection globally.
All six of the articles will be archived within a specific section of the PV-Tech website, allowing any interested party to understand fully how the final bankability metrics of all PV module suppliers are derived and calculated.
Manufacturing supply (S) strength score methodology
The manufacturing supply factor (S) captures market-share by branded module shipment volume, and has routinely been part of solar PV ranking tables for many years, albeit in a very simplified and generic version.
Shipment of branded modules includes modules assembled at company-owned facilities, in addition to outsourced (or third-party) supply where end-market shipped product is relabelled to that of the company making the sale. Third-party outsourcing has been used frequently within the solar industry for many years, either to supplement short-term spikes in order pipelines, or to circumvent origin-of-manufacturing location constraints arising from trade tariffs or related (production) barriers.
Ranking tables for module supply are often done on an annual (calendar year) basis, typically confined to top-10 shipment estimates. These rankings should always be restricted to branded-module shipments to end-market customers (sometimes called merchant shipment volumes, specifically excluding any OEM supply or subcontract production line leasing). Many times however, the definitions are lacking, or the rankings were compiled in the absence of any understanding of the different factors that make up any module supply shipment numbers in the first instance.
Therefore, shipments volumes for our analysis are defined as own-company branded, including both in-house produced and third-party/OEM supplied. This is essentially how most leading module suppliers operate in the PV industry, with the exception of a few that are technology-specific.
The analysis starts by identifying each company’s megawatt (MW) shipments (Ship) by quarter. These quarterly shipments are then allocated to one of six (j=1…6) end-market regions (Reg). Each of these segmented numbers is then split into non-residential contributions (Ship’).
Non-residential allocations are comprised of commercial, industrial and utility-based shipments, abbreviated here as CIU. While the PV industry does not have universally accepted nomenclature for end-market segments (as defined by customer type or mounting arrangement), the use of residential/non-residential is the most important grouping mainly because residential deployment is largely absent of supplier due-diligence and bankability studies (common to larger utility-based projects). Non-residential is routinely labelled as commercial, industrial or utility, by different PV companies, with the terms somewhat interchangeable.
Having removed the residential part of the quarterly/regional company shipment volumes, this completes the company specific quarterly segmentation of the input data. The remaining analysis now uses these data values combined with historic and future market demand, as explained below.
Shipment strength is often considered in the PV industry to be based on market-share, whether globally or sometimes by region/country, and mostly covering calendar year periods in the past.
However, market-share claims are rarely substantiated, qualified or confirmed by any independent agency. Furthermore, market-share studies often lack country/region segmentation, time-period determination and deployment specifics (e.g. residential or non-residential).
One of the most important issues when looking at supplier shipment strength is to track this over defined time periods, and then adjust these values on a rolling basis each quarter.
In this regard, the next step in the analysis is to look at the trailing 24 months (t24m) of data within each subset above. Looking at a two year period at the end of each quarter (eight quarters, 24 months) turns out to be of greater value than a specific quarter; or indeed any 12 month or calendar year period which is not long enough to smooth out any short-term abnormalities in supply, possibly arising from adjustments to trade-related issues or technology-upgrades, etc.
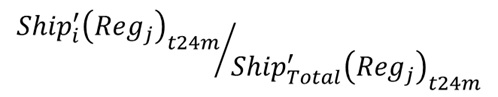
For each company (i), quarterly CIU shipment volumes by region are summed over the eight previous quarters (t24m period at quarter end), and converted into regional market-shares by dividing this by the t24m sum of the total module shipments (CUI specific) into each of the six global regions. This now provides meaningful market-share information, being quarterly, regional and CIU specific, expressed as:
While the output from the above analysis sheds light on the sales tactics of PV module suppliers globally, it is nonetheless confined to historic activity, which may or may not have significance going forward. Put another way, market-share in any given region is only relevant if strong demand levels are expected in this region going forward. Often, within the PV industry, this is not the case, as has been seen on countless occasions when policies are changed, new governments come to office, or markets get saturated (short-term) with energy supply from renewables.
To understand this better, one can consider Chinese companies prior to 2010 when supply was dominated by module sales to Europe (in particular Spain, Germany and Italy). Policy changes in these countries then meant that historic market-share allocations to Europe were less meaningful going forward. There are many other examples where served market sizes of specific countries/regions have changed almost overnight in the PV industry, rendering legacy sales/marketing efforts as somewhat irrelevant to future company operations in this region/country.
This proved to be a critical part of the overall manufacturing supply rankings analysis. To address this, it is necessary to use two scaling factors applied to the regional market-share data obtained earlier.
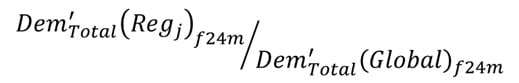
The first scaling factor considers the total future CIU market demand (Dem) in each of the global regions considered, as a percentage of the overall total global CIU demand, two years out at the end of each quarter, shown as forward-24-months (f24m) to be consistent with the historic (t24m) terminology.
The inputs here are among the few qualitative data entries within the overall studies, to the extent that the data is based on forecasted demand (module supply) two years out for any given quarter. Obviously, when looking at any historic data more than eight quarters in the past, the data moves from qualitative to quantitative since the f24m entries have already occurred. The first scaling factor can therefore be expressed as:
The second scaling factor is equally important, and it is here that end-market risk is introduced. This is critical to understand since end-market regional policy or similar demand-related market factors create risk to future deployment. Any market-related issue that introduces risk to demand has to have a direct impact on the value of any legacy market-share coverage (shipment volumes) of any module supplier into that region.
This is done by assigning a demand-specific risk factor (Risk) by quarter/region, based on the f24m period at any given time. The resulting scaling factor is therefore expressed as:
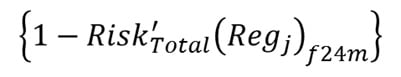
Through this analysis, supply scores are assigned to all module suppliers at the end of each quarter; for CIU deployment into each of the six global regions considered; based on historic market-shares (ratioed against t24m global CIU demand); and scaled against future (f24m) regional CIU demand and associated demand-risk/uncertainty at the regional level again.
The final score for all module suppliers (by quarter-end) is then the sum of the scores for each of the regions, and can be expressed as:
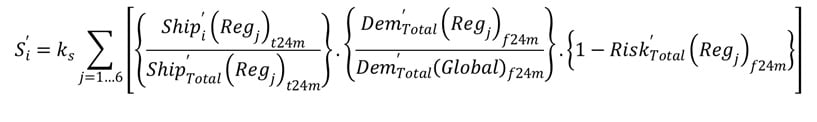
The scaling factor k is used to put the scores in 0-10 bands, and is set quarterly by looking at the overall distribution of scores and standard deviation values each quarter. This allows the relative manufacturing supply strength of any company to be understood each quarter, benchmarked against other companies.
It should be noted that if just the historic terms are summed up (t24m), this yields module shipment rankings by shipped volume only. If the t24m period is then changed to 12 months (ttm), and the point of reference is at year-end (end Q4), then the output is simply the annual module tables, routinely cited by industry observers, but confined in this case to the CIU segments (i.e. non-residential).
Manufacturing supply (S) strength score output
Aside from the manufacturing supply score (S) that forms one part of the overall manufacturing health score (M), there is a wealth of output metrics that arises from the analysis above. However, the main objective here has been to score all PV module suppliers based on the strength of supply going forward, and to benchmark companies with one another over time on a common 0-10 band/scale.
The graph below shows the supply scores (S) for the top 50 module suppliers (by volume) within the analysis, with the t24m periods fixed in this case at the end of each calendar year from 2014 to 2019 for ease of display. Therefore, the 2019 scores should be indicative of the industry as seen today (July 2019).
To help illustrate the value of this analysis, four companies are highlighted in the graphic, characteristic of changes seen within the six-year period illustrated in this case. The companies chosen here are JinkoSolar, First Solar, LONGi Solar, and Yingli Green.
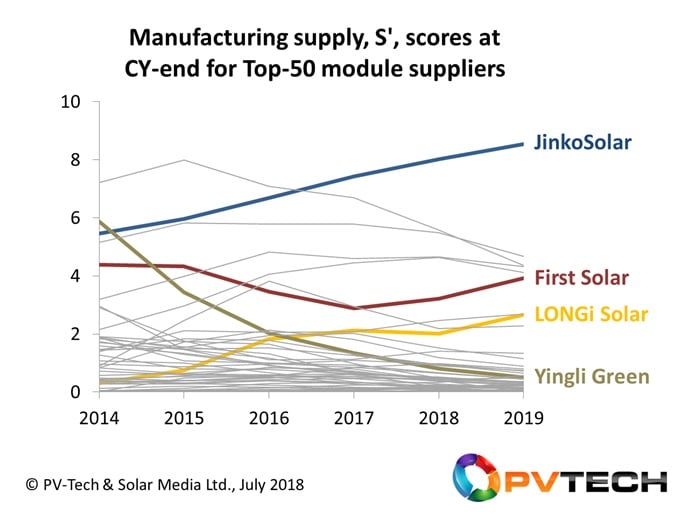
The trending fortunes of all PV module suppliers can be understood by looking at the relative t24m scores, whether at calendar year-end (as in the above graphic) or during the year at each quarter-end. The four companies highlighted above serve to illustrate this statement.
Going bottom-to-top in the list of highlighted companies, Yingli Green (a previous market leader) has seen its manufacturing supply strength collapse between 2013 and 2019, despite the company still being a multi-GW module producer. While shipment volumes have been falling in recent years, the decline is mainly coming from overreliance on one regional market (China) that has been subject to various policy and future-demand risk factors over the past 18 months.
LONGi Solar’s supply strength profile is coming mainly from increased module shipments since 2014, with the current upward trend also driven by having a more global end-market reach (that by default helps to smooth out any country/regional specific demand risk).
First Solar’s profile in the graphic above illustrates the impact of having a broader (non-China) end-market supply split, while staying away in recent years from high-risk regions such as India, coupled with greater volumes available from production with new capacity.
Finally, JinkoSolar’s trending and scores (in particular from 2016) illustrates just how dominant the company has become within the industry over the past 2-3 years. Aside from having the greatest shipment volumes recently (by quarter, calendar year or t24m period), the delta between JinkoSolar’s supply score and all other companies is coming from the focus on high-growth, and low risk regions. This is explained in part by the company diverting shipments away from China and India for example during 2018/2019.
JinkoSolar’s leading manufacturing supply strength status is therefore further evidence that companies increasing module shipment levels need to be ahead of the curve in terms of the end-markets that sales/marketing efforts are assigned to, and not simply grabbing market-share in areas that have limited long-term strategic growth potential; more on this topic across the six articles making up this series.
Finally, it should be pointed out also that the methodology above can be adapted to be end-market specific, revealing the strength of supply for all companies into certain regions, at any given time period, and can be used to model the effect of abrupt policy/political changes in the future.
Previewing the next part of the article series
The next article in this series will focus on the middle term in the manufacturing health score analysis; capacity (C). This incorporates the value of module capacity available in-house to each company (segmented by in-house and third-party cell supply) across eight different global manufacturing regions; and how this allows certain companies to be well positioned to navigate trade-related issues based on module (and cell) origin-of-manufacture.
Attend PV ModuleTech 2019 to hear the first presentation on the findings
The full results of the overall study will be released by the PV-Tech market research team before the end of August, with the key findings presented, explained and discussed in the 45 minute opening talk I will be giving at the forthcoming PV ModuleTech 2019 event in Penang on 22-23 October 2019.
PV Tech’s bankability analysis series links are below
Part 1. PV-Tech research set to reveal investment grades for global PV module suppliers
Part 2. PV-Tech research reveals how to assess PV module suppliers’ capacity claims
Part 3. PV-Tech research establishes technology-leadership scorecard for top-100 module suppliers
Part 4. PV-Tech research reveals ranking tool for manufacturing strength of global module suppliers
Part 5. PV-Tech research ranks PV module suppliers by financial health
Part 6. First PV module supplier bankability ratings tool created by PV Tech research team


