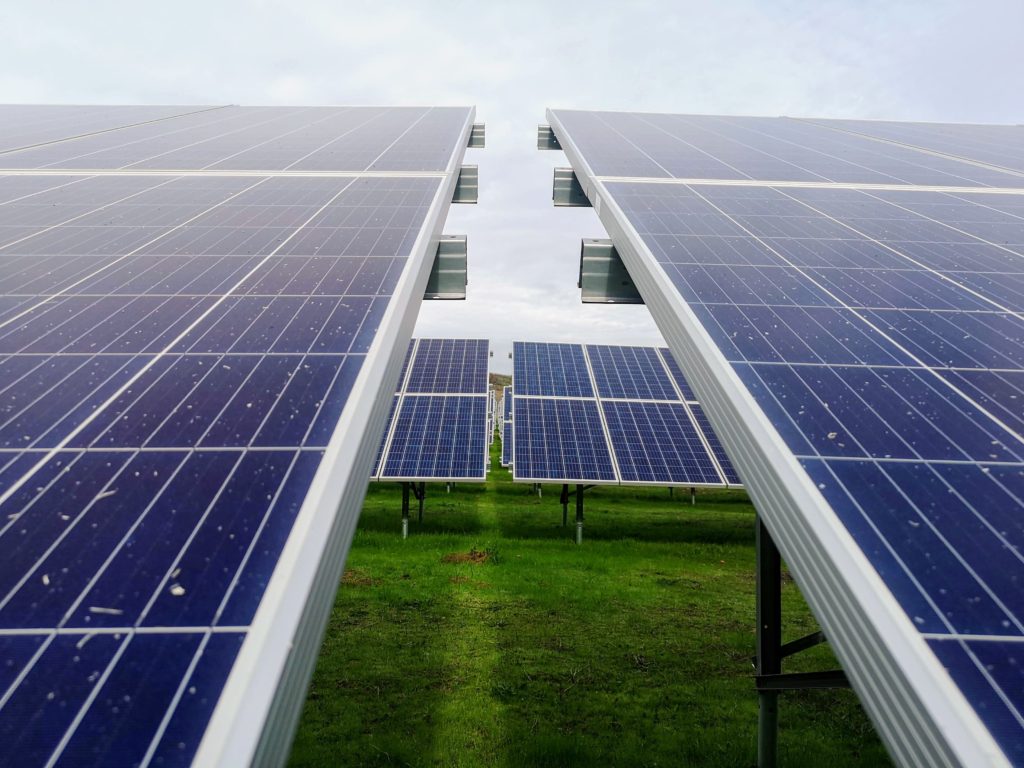
Aside from the immediate, visible damage, extreme weather events have a longer lasting impact on PV systems. NREL’s Dirk C. Jordan, Kirsten Perry, Robert White, Josh Parker, Byron McDanold and Chris Deline report on research revealing the long-term consequences of hail, wind and other weather phenomena on PV production.
Try Premium for just $1
- Full premium access for the first month at only $1
- Converts to an annual rate after 30 days unless cancelled
- Cancel anytime during the trial period
Premium Benefits
- Expert industry analysis and interviews
- Digital access to PV Tech Power journal
- Exclusive event discounts
Or get the full Premium subscription right away
Or continue reading this article for free
Terrestrial photovoltaics has its origins in the late 1970s and early 1980s. Cost, efficiency and reliability were the focus then—as they are today— to increase PV adaptation. Systematic investigations and improvements in reliability started in the USA in the Jet Propulsion Laboratory (JPL) so-called Block Buy programme.
Many of the standard tests are still being used today to ensure quality can be traced to that time, with additional tests coming from a European effort. These quality measures played no insignificant part in the remarkable success PV has enjoyed in the last 40+ years, leading to the astonishing installed capacity curve of Figure 1.
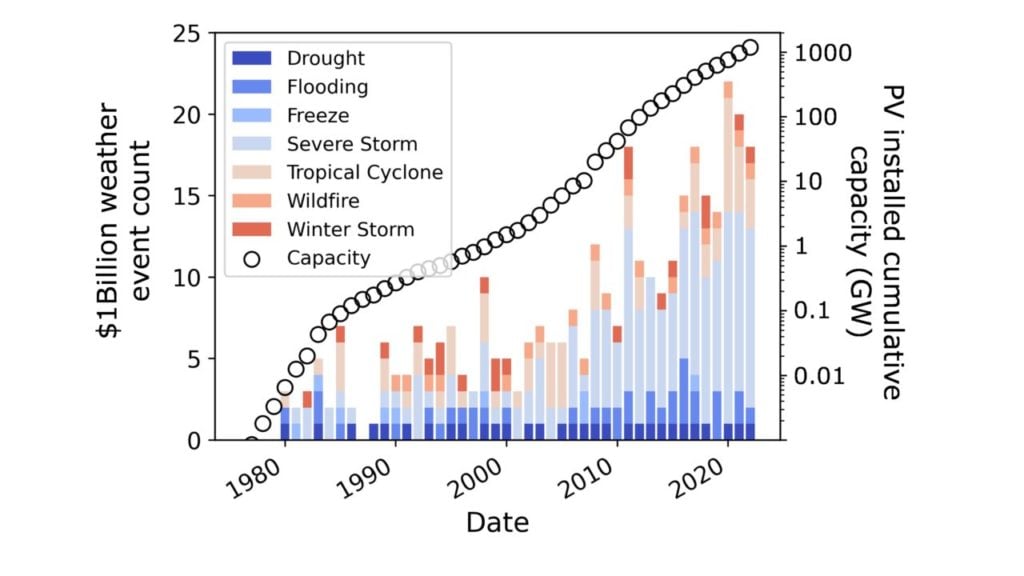
Testing for extreme weather conditions such as temperature extremes, but also hail impact and wind loading, were a concern even in these pioneering days. Additionally shown in Fig.1 is the frequency of extreme weather events— weather events that caused more than US$1 billion damage (inflation-adjusted)— from the National Oceanic and Atmospheric Administration (NOAA) database [1]. Coincidentally, the database also goes back to approximately the same period.
As global installations have increased, so has the number of these extreme weather events. This begs the question: how have these events impacted PV installations today? And what, if anything, can the PV community do to increase resilience? PV quality standards are continuously adapted to new field observations and an investigation like this could ultimately lead to higher quality products.
Method
In this analysis we compared NOAA’s database on extreme weather events with our own PV Fleet Data Initiative time series database. The NOAA Storm Events Database specifically documents storms or other significant weather phenomena such as hurricanes, floods, hail and windstorms etc. with high enough intensity to cause loss of life, property damage, injuries, or disruption of commerce. Data in the storm events database includes the start and end date of the event, event type, starting and ending latitude-longitude coordinates, as well as event severity, when applicable. It is important to note that multiple storm event types can occur simultaneously in the same geographic area; for example, a location may experience lightning and a windstorm simultaneously.
The other database, the National Renewable Energy Laboratory (NREL) PV Fleets database, contains time series performance data from more than 24,000 inverters’ data and over 3700 PV sites, with most sites commercial or utility scale. The total installed capacity is more than 8GW with a mean site age of more than five years [2].
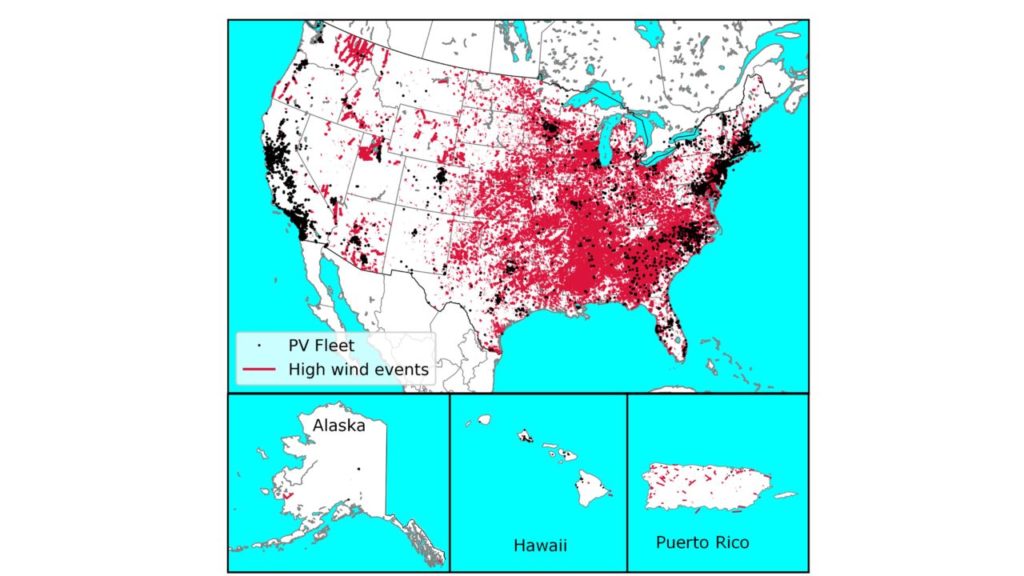
As an example, Fig. 2 shows a map of high wind events (red) for the USA and Puerto Rico overlaid by the PV Fleet systems (black). To build relationships between storm data and PV system data, the latitude-longitude coordinates associated with each storm event were compared to PV system latitude-longitude coordinates. Specifically, storm events within 10 kilometers of a PV system, occurring during a period where measured time series data for that system was available, were marked for further analysis.
To calculate the long-term impact, we determined performance loss rates (PLR) using the open-source software package RdTools [2]. Because the methodology is based on a year-to-year comparison, at least two years before and after the associated weather event were required. Consequently, some systems were eliminated for not meeting this requirement.
Irradiance sensors can substantially bias PLR measurements if not calibrated every other year. Therefore, we used satellite data from the National Solar Radiation Database (NSRDB) [3]. The current NSRDB provides data within 4km horizontal resolution and the irradiance may differ within that resolution window, especially on partly cloudy days. Hence, we filtered for clearsky and therefore relatively stable outdoor conditions, allowing us to detect smaller changes in PLR [4].
Long-term results
The impact of different hail sizes on long-term performance losses is summarised in Figure 3 (a). The blue and orange boxplots show the PLRs before and after the hailstorm, respectively. Individual data points are overlaid with a representative uncertainty bar from the analysis given for each category. For the smallest hail category, approximately the size of peanuts, no higher PLR after storms was detected. However, each hail category of 25mm or greater displays statistically significant higher PLRs after the storms.
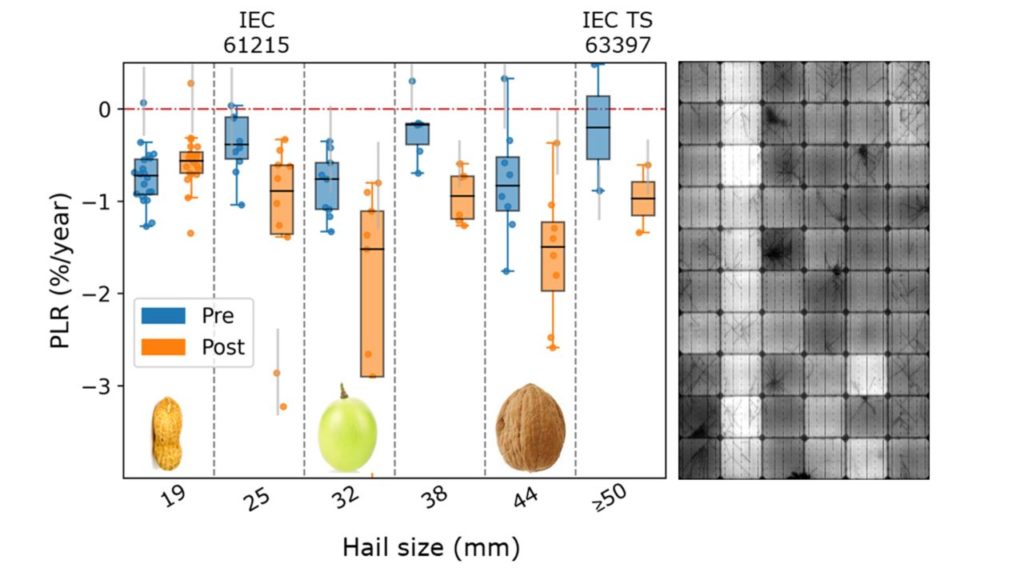
Of particular interest is the 25mm hail size because that is the hail size used in the International Electrotechnical Commission (IEC) module qualification test standard 61215. Although the modules used in these systems were qualified to that hail size, when exposed to that same size hail in natural settings, higher PLRs resulted. Several possibilities exist that may explain the discrepancy: first, in hailstorms, more strikes below the maximum size may occur and deliver more kinetic energy to the module [5]. In addition, naturally occurring hail may not be round, as used in indoor tests. Furthermore, differences in mounting configuration between indoor and outdoor settings may be present. Finally, after exposure to hail outdoors, thermal cycling from diurnal and seasonal changes always follows the hail exposure.
Thermal cycling is used following larger hail exposure in the more stringent hail testing standard IEC technical specification 63397, which was published at the end of 2022 [6]. More widespread adaption of this new standard is required to validate or fine-tune the test procedure and improve product quality.
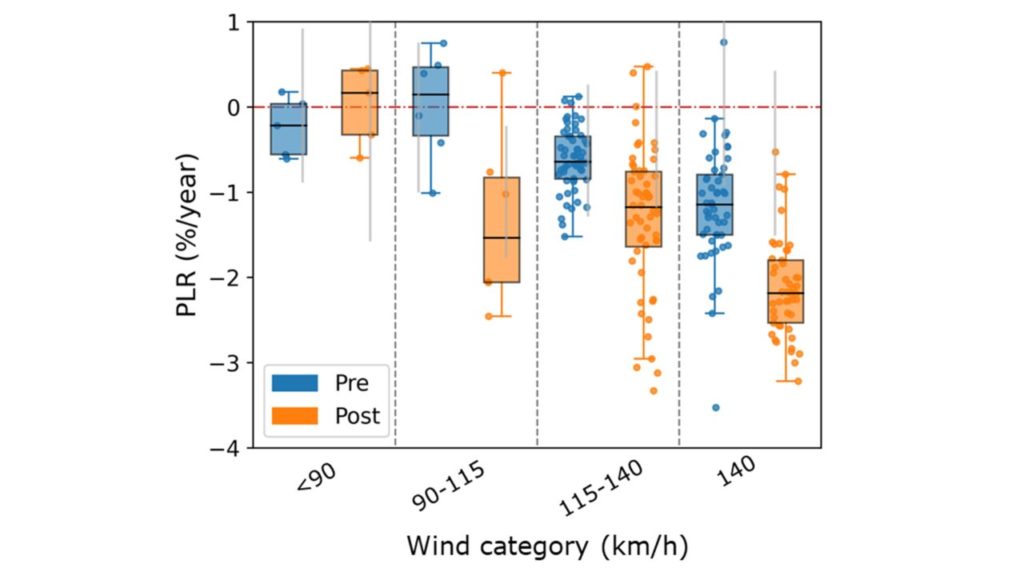
As with hail, systems exposed to differing high wind speeds reveal an analogous threshold behaviour shown in Figure 4. For the wind analysis, we found the threshold to be about 90 km/hour or about 55 miles/hour, below which no higher PLRs can be detected. However, most systems exposed to higher wind speeds exhibit higher PLRs after windstorm exposure. In this case, most but not all systems display this behaviour because some sub-systems are wind sheltered by other systems or adjacent structures at the same site. An informative example of this performance is presented in the next figure, Figure 5.

This is a site in the desert Southwest of the United States of America (USA) where the same modules were installed on different buildings in different mounting configurations. PLRs before a severe windstorm are given again in blue. The initial different degradation behaviour is because of the mounting. Building A and the gymnasium have large sections close-mounted to metal roofs and therefore experience higher degradation prior to the storm.
After the windstorm, which was situated to the Northwest of the site, the gymnasium, as the highest building, exhibits a substantially higher PLR. In contrast, building A shows unchanged behaviour because it was wind sheltered by the gymnasium. Buildings D (carport) and B were precariously exposed to wind gusts in the 90-115 km/hour range and exhibit greater PLRs after the storm. However, building C shows almost unchanged behaviour despite the exposure.
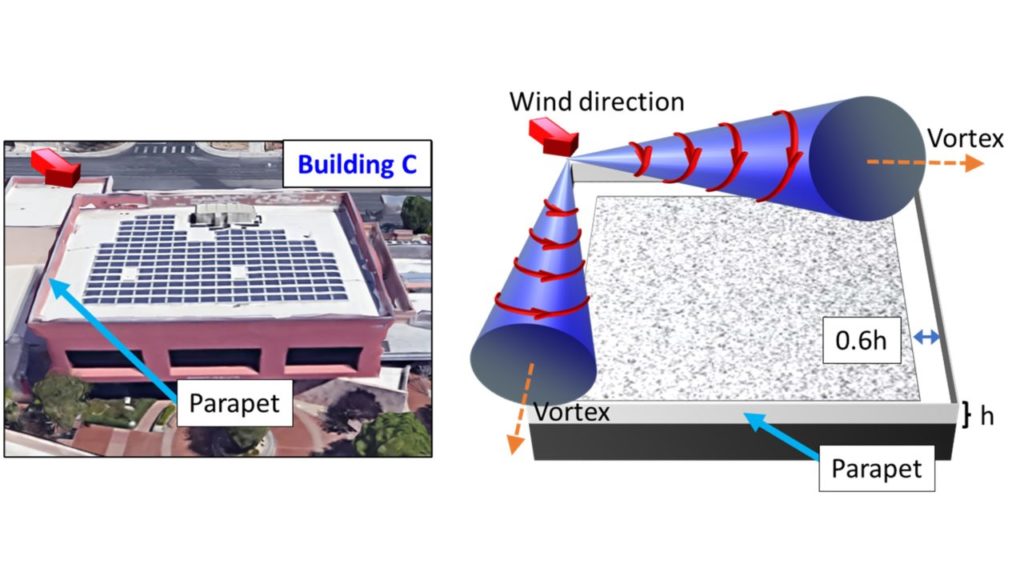
An explanation may be provided in Figure 6 with an adaptation from the Structural Engineers Association of California. The top of building C is surrounded by a parapet that can have an important impact on the resilience of the PV system. As the wind flows across the building, vortices form at the edge of the building where modules, if mounted in that zone, can experience pronounced uplifting forces.
The width of this zone depends on a variety of factors such as wind speed, the parapet height, etc. [7]. Building C has no modules mounted in the zone that experience strong forces, which may provide an explanation for the almost unchanged long-term performance of the system.
In contrast, the system in Figure 7 was exposed to similar wind gusts, but it is immediately noticeable that the modules are very closely mounted to the edge of the roof without a parapet. In this case, modules were damaged and about half a dozen modules were uplifted from the roof to the ground.
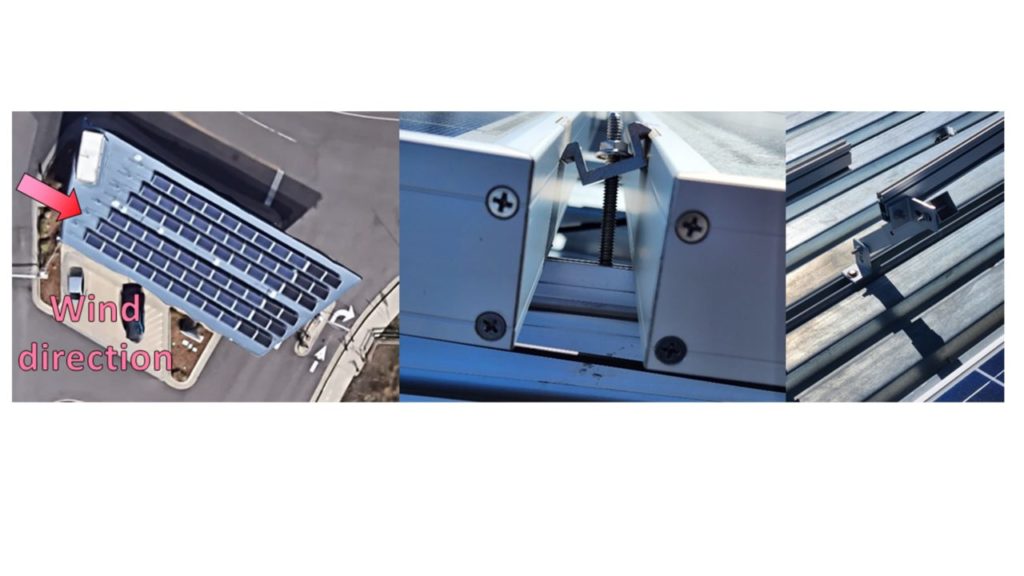
category (a). Double clamp failure (b) and bent mounting rack (c) after the storm. Image: NREL.
Yet, improvements in the design of the system and in the quality of the installation could have possibly prevented the damage the system incurred. The usage of double clamps, Fig. 7 (b), is not recommended for high wind-prone areas. Instead, through bolting is the preferred method [8,9]. In addition, adequate mounting strength brackets are needed for such exposed locations, Fig. 7 (c).
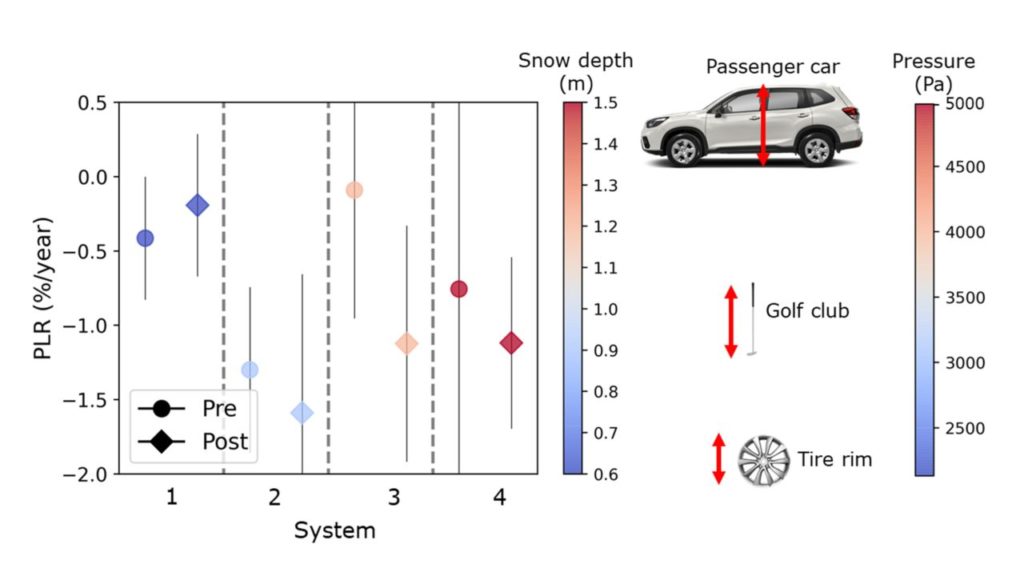
A third weather type we examined for long-term performance losses was extraordinary snowstorms, as shown in Figure 8. The data is coloured by snow depth and pressure in Pascals, with size comparisons shown. The weight of snow can vary considerably from 0.2kg per centimeter (cm) of depth per square meter (m2) of area of dry snow to ca. 9kg/(cm m2) of ice [10]. In this case we used a medium value of typical wet snow of 3.8kg/(cm per m2). All these systems were located in northern latitudes making it unlikely that the snow melted quickly after the storms. Furthermore, the storms impacting these systems were all associated with considerable wind exposure in late winter, increasing the likelihood of high-water (heavy) content. No direct measurements of the water content of the snow were available, therefore the conversion into pressure should be considered only as an approximate value. Similar to wind and hail, a threshold of ca. 1 meter depth seems to exist, above which higher PLRs may be expected. However, higher quality data is needed to confirm these preliminary findings.
Short-term results
Apart from long-term consequences, shortterm outages can occur following extreme weather events, an example of which is shown in Figure 9. In that case, a small tornado uprooting several trees along the North-South running road was reported. The production of three inverters within a day of the event is given in Figure 9 (b).
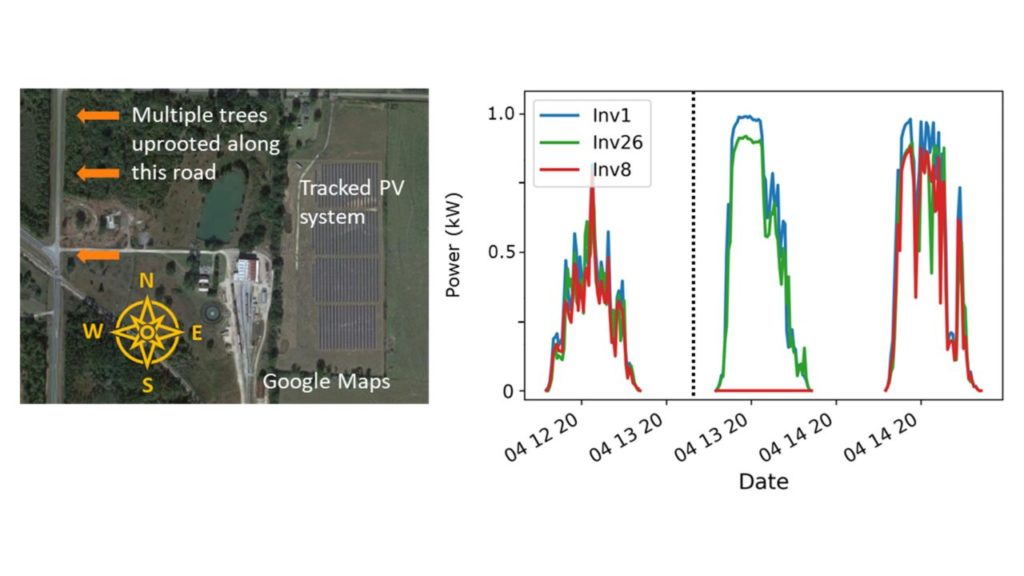
The dotted vertical line indicates the timing of the wind event. At this particular site, 26 inverters were installed, but only one of them was offline the day following the tornado. Therefore, this particular plant lost only the production of one inverter on one day. Inspecting all the time series following storm events, we can integrate the lost production for all 170 identified crystalline silicon systems. It is important to note that multiple storm effects can be associated with a single storm. For example, flooding and heavy rain could occur within hours over a single storm, and both events would be considered contributors to a PV system outage.
We also estimated lost annual production from the downtime intervals using PVWatts simulation [11]. Figure 10 (a) displays the distributions for flooding and high wind events and hail and lightning in Fig. 10 (b).
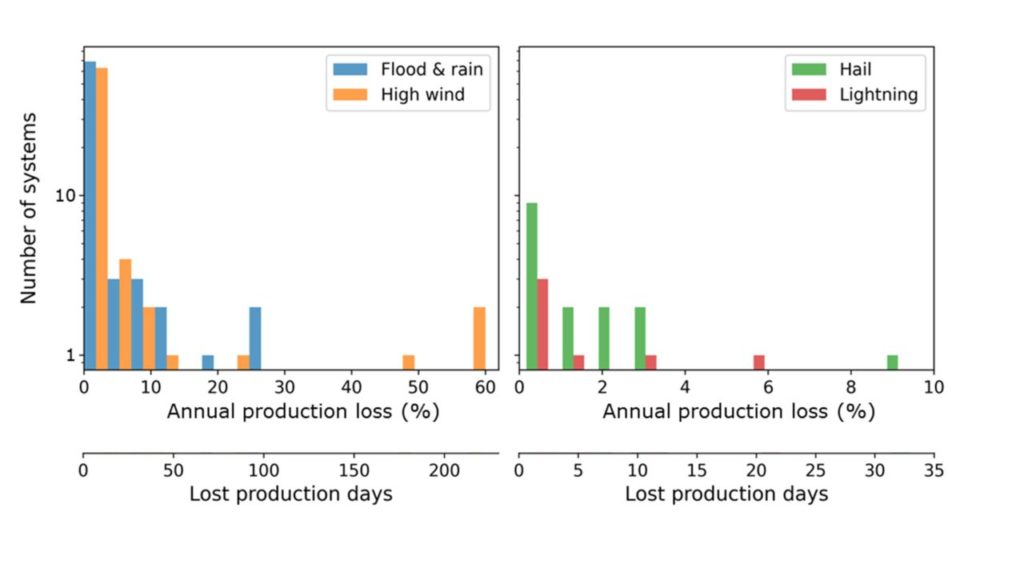
hail and lightning (b). The secondary horizontal axis displays the lost production days. Chart: NREL.
The primary horizontal axis displays the estimated production loss while the secondary horizontal axis shows the number of lost production days. Both overlaid histograms exhibit markedly skewed distributions although at different scales. At the median, all these weather events have an impact of around 1% of annual lost production or between two and four days, which is relatively small. However, a few systems are much more severely impacted, as can be seen in the tail of Figure 10.
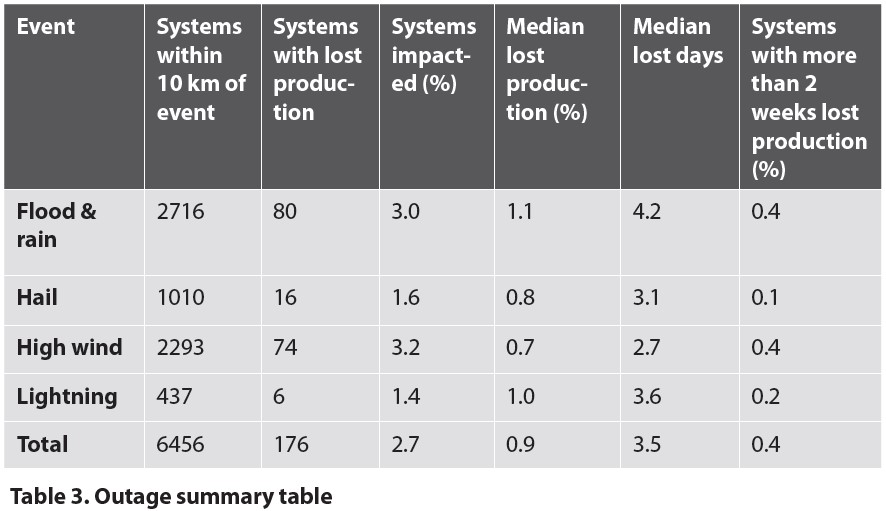
More details including the percentage of systems losing more than two weeks of production are provided in Table 3. This tail is especially pronounced for floods and high wind events.
Therefore, from a fleet perspective the short-term impact of these extreme events is relatively minor, yet the risk is exemplified in the long tail of the distributions.
Because we did not have full operations and maintenance (O&M) tickets for these specific systems, it is not clear if the loss was caused by damage to the system and possible associated safety aspects or merely a communications issue. Finally, the risk associated with the long tail of lost production demonstrates the need to continue to build systems engineered to withstand safely the extreme weather that may occur over the decades-long expected lifespan of the modules.
Conclusion
Severe weather has been increasing in frequency and impact. We investigated the impact of some of these severe events on the performance of PV systems from a fleet perspective. Median short-term outages led to production losses of only approximately 1% of annual production per event. Yet, a long tail extending to 60% annual losses is an ominous sign of the risk extreme weather may pose to PV production.
Long-term consequences in the form of increased degradation beyond specific thresholds were found for hail, high-wind and snow events. Yet, the PV community can be proactive and minimise the impact of these serendipitous events by focusing on quality systems, components, designs and installations. More stringent hail testing and adoption of a higher hail testing standard is required. Different testing for dynamic (wind) and static (snow) mechanical loading may be required to improve system resilience.
Quality design and installations are also an integral part of storm resilience and require the development of a well-trained workforce. However, recent industry trends such as larger module formats, thinner cells and thinner front glass may increase system vulnerability. Despite these long-term challenges, PV can provide extensive backup power and save lives when infrastructure is damaged by extreme weather events. Finally, although this study is limited to events and deployments in the USA, we hope to lessons can be applied internationally.
Acknowledgement
The authors would like to thank James Elsworth, and Katherine Jordan. This work was authored in part by Alliance for Sustainable Energy, LLC, the manager and operator of the National Renewable Energy Laboratory for the U.S. Department of Energy (DOE) under Contract No. DE-AC36-08GO28308. Funding provided by the US Department of Energy’s Office of Energy Efficiency and Renewable Energy (EERE) under Solar Energy Technologies Office (SETO) Agreement Number 30295. The views expressed in the article do not necessarily represent the views of the DOE or the US Government. The US Government retains and the publisher, by accepting the article for publication, acknowledges that the US Government retains a nonexclusive, paid-up, irrevocable, worldwide license to publish or reproduce the published form of this work, or allow others to do so, for US Government purposes.
References
1 NOAA National Centers for Environmental Information (NCEI) U.S. Billion-Dollar Weather and Climate Disasters (2023).
2 M. Deceglie, A. Nag, C. Deline, A. Shinn, G. Kimball, D. Ruth, D. Jordan, J. Yan, K. Anderson, K. Perry, M. Mikofski, M. Muller, W. Vining, RdTools v2.1.0 beta.1. Computer Software. https://github.com/NREL/rdtools. DOI: 10.5281/zenodo.4307010.
3 M. Sengupta, Y. Xie, A. Lopez, A. Habte, G. Maclaurin, J. Shelby, ”The National Solar Radiation Data Base (NSRDB)”, Renewable and Sustainable Energy Reviews 89, pp. 51-60, 2018.
4 D.C. Jordan, C. Hansen, Renewable Energy, 209, 393 (2023).
5 P. Bostock, “Hail Cat: Presenting a Method to Identify, Quantify, and Mitigate Hail Risk”, PV Reliability Workshop, Golden, CO, USA, 2023.
6 IEC TS 63397:2022, “Photovoltaic (PV) modules – Qualifying guidelines for increased hail resistance”, 2022.
7 Structural Engineers Association of California, Wind Design for Solar Arrays, Report SEAOC PV2-2017, July 2017
8 C. Burgess., S. Detweiler, C. Needham, F. Oudheusden, “Solar Under Storm Part II: Select Best Practices for Resilient Roof-Mount PV Systems with Hurricane Exposure”, Clinton Foundation, FCX Solar & Rocky Mountain Institute, 2020.
9 National Renewable Energy Laboratory, Sandia National Laboratory, SunSpec Alliance, and the SunShot National Laboratory Multiyear Partnership, “Best Practices for Operation and Maintenance of Photovoltaic and Energy Storage Systems”, National Renewable Energy Laboratory. NREL/TP-7A40-73822, 2018.
10 https://roofonline.com/weights-measures/weight-of-snow/?utm_content=expand_article
11 M. Sengupta, Y. Xie, A. Lopez, A. Habte, G. Maclaurin, J. Shelby, ”The National Solar Radiation Data Base (NSRDB)”, Renewable and Sustainable Energy Reviews 89, pp. 51-60, 2018.
Authors
Dr. Dirk Jordan is a Distinguished Member of Research Staff at the National Renewable Energy Laboratory in Colorado, USA. He received a Ph.D. in physics from Arizona State University and a B.S. in physics from the University of Heidelberg, Germany. He specialises in performance and degradation of PV modules and systems.
Kirsten Perry is a data scientist at NREL in the PV Reliability & System Performance Group. Her research is primarily focused on developing solar analytical solutions to assess photovoltaic field performance data, with a particular emphasis on applying deep learning and machine learning techniques.
Robert White is a senior data scientist with a background and degrees in astrophysics from New Mexico Tech and the University of Texas. He has been working at the National Renewable Energy Laboratory for 15 years in PV materials and performance, focusing on autonomous systems and big data analysis.
Josh Parker is a photovoltaic research technician at the National Renewable Energy Laboratory. His focus is on diagnostics, fabrication, instrumentation, and calibration of diverse outdoor testbeds on NREL’s campus. Josh comes from an extensive background in BMW automotive repair and diagnostics.
Byron McDanold is a research technician at the National Renewable Energy Laboratory specialising in long term photovoltaic reliability and durability. He received his bachelor’s degree in mechanical engineering from the University of Colorado, Denver. Byron specialises in the construction, maintenance, instrumentation, and calibration of numerous long-term outdoor tests.
Dr. Chris Deline is the group manager of the PV Field Performance Group at the National Renewable Energy Laboratory. He also manages the PV Fleet Performance Data Initiative, which aggregates and analyses third-party field performance data and manages the PV Proving Grounds programme for field assessment of novel PV technologies.


