
While collecting verified bottom-up project data in real time has previously been cost-prohibitive, satellite data can now be leveraged to make comprehensive market intelligence attainable for investors. Daniel Cruise and Joseph Triepke, partners at energy intelligence firm Lium Research, reveal how satellites can provide more reliable insights into the construction of US utility-scale solar projects.
Since the inception of the utility-scale solar industry, market participants have largely relied on anecdotes, surveys, conjecture from industry lobbyists and government/ISO data for market intelligence.
Try Premium for just $1
- Full premium access for the first month at only $1
- Converts to an annual rate after 30 days unless cancelled
- Cancel anytime during the trial period
Premium Benefits
- Expert industry analysis and interviews
- Digital access to PV Tech Power journal
- Exclusive event discounts
Or get the full Premium subscription right away
Or continue reading this article for free
Consensus forecasts are not grounded in visual research carried out on a project-by-project basis as a general rule. There are two main reasons for this knowledge gap, and both are changing now.
First, the industry used to be much smaller so conventional wisdom was ‘good enough’. When less than a hundred projects were under construction at any given time, bottom-up project assessments weren’t as important. Over the past five years, the US only installed an average of 8GW of utility-scale solar capacity per year. In that environment, relying on sometimes biased and sometimes inaccurate industry chatter was good enough for many folks to check the ‘we’ve got market intel’ box. This is changing now. Over the next five years, annual US utility-scale installations will more than triple to >30GWac with over 200 big projects now in construction and another 400 in pre-construction mode. The scale inflection, increasing sophistication of the market, billions of dollars flowing into the space and an ever-growing number of market participants require capital allocators to be better informed with verified and actionable data. Relying on guesswork is increasingly risky, irresponsible and potentially costly.
Second, collecting verified bottom-up project data in real time was cost-prohibitive. Getting eyes on every US solar project each and every day the old-fashioned way would cost an arm and a leg. Imagine hiring one full-time employee to drive out to two sites under development each day and take pictures. At today’s rate of construction, you’d need more than 300 full-time employees to monitor the US utility-scale solar market that way. That’d cost you US$15 million a year. Obviously not happening. This is changing now. Satellite data can be leveraged in conjunction with proprietary algorithms and time-tested research methods to make comprehensive real-time market intel attainable and cost-effective for many investors and market participants. Furthermore, satellites can generate even better bottom-up project insights than the old boots-on-the-ground approach can at a fraction of the cost. As the adoption of satellite monitoring of potential solar sites grows, hard data will begin to eliminate the cognitive dissonance we sometimes see in discussions about industry trends today.
If you had eyes on every large-scale solar project in the US construction queue every day, what would you see that others miss? Where would bottom-up data depart from the top-down industry narrative? What could be learned about individual company market share and performance that could create new business for suppliers and developers or alpha for investors?
How solarSAT is being used
Introduced by Lium Research in mid-2022, solarSAT is a new indicator for US utility-scale solar activity that leverages satellite intel to track construction progress in real-time.
How does it work? Utilising machine learning, proprietary algorithms and human touch, solarSAT interprets thousands of real-time images from satellites trained on hundreds of potential US solar projects, including all projects 50MW or greater, for complete US Lower 48 coverage.
Daily changes are monitored to track groundbreaking (firstDIRT), panel delivery and installation. Data is then aggregated into various datasets and monthly summary outputs. With visual verification, this approach removes the guesswork from trend assessments.
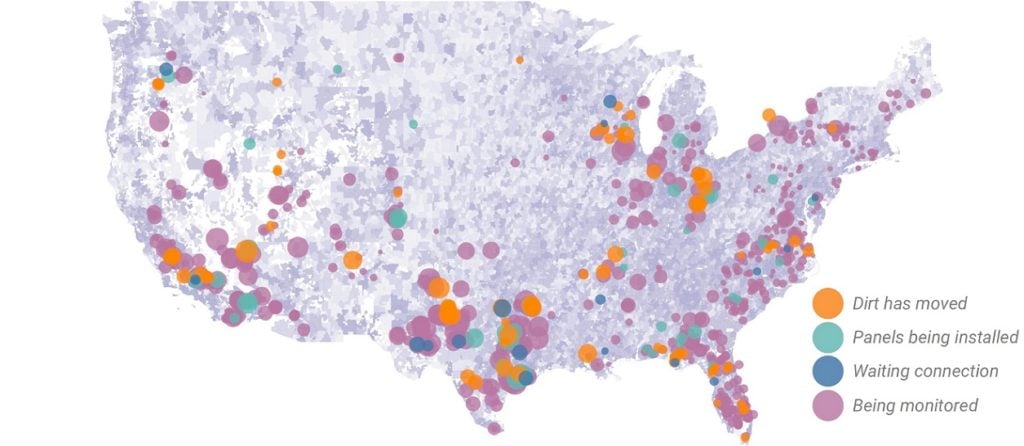
Data can be analysed at the industry-wide, project or company level. For the first time, investors and corporate management teams can now monitor the status of all US large-scale solar projects, including the day each project broke ground, timing of panel deliveries, supplier relationships and final completions.
Some of the use cases being pursued by early adopters of this new technology include:
- Leading indicator statistics for panel and tracker installations
- Forecasting future capacity and installations
- Market share assessments on developers and supply chain providers (i.e., trackers and panels)
- Identifying vendors on a project-by-project basis
- Independent company benchmarking
- Monitoring project timing, delays and details
- Customer tracking, supplier tracking and competitive landscape analysis
When reality departs from the mainstream narrative
Getting eyes on field-level progress comprehensively is really the only way to confirm or challenge, with absolute clarity, the narratives percolating in the industry today. And for investors and management teams, being on the right side of these trends can make a huge difference for the bottom line.
At times, what satellites see actually happening in the field departs from certain ideas that have become deeply rooted in consensus thinking, revealing actionable opportunities for capital allocators.
A recent example was in April 2022 when misleading surveys related to tariffs exaggerated fear and misallocated investor capital. Alternatively, tracking industry data with satellite imagery would have painted a very different (less draconian) and more accurate picture of what was actually happening on the ground.
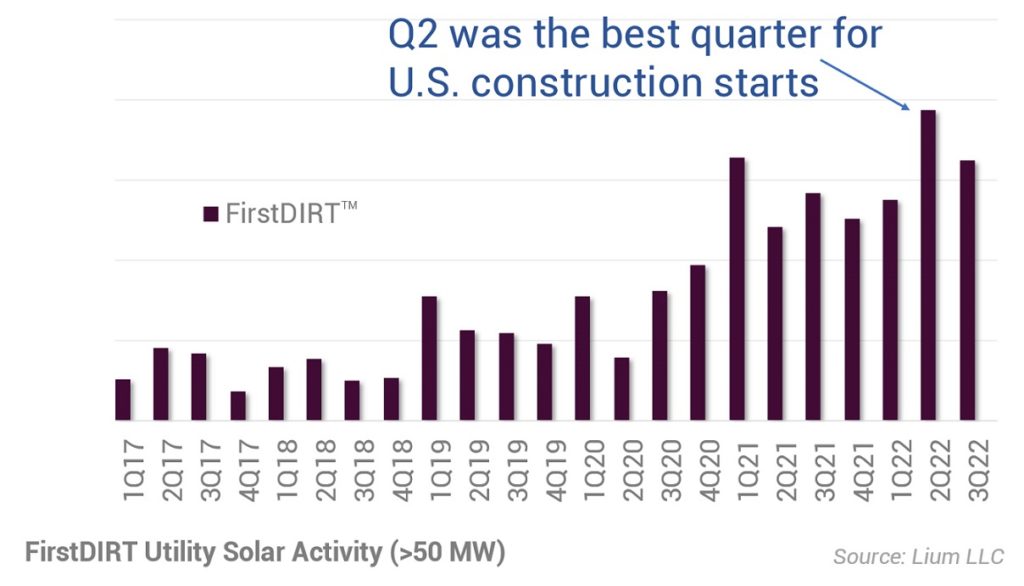
Based on satellite data, activity was much stronger than generally thought among the industry last year. In fact, as shown in the graph below, Q2 2022 (a quarter when fear and misinformation about shutdowns were rampant) was actually the best quarter for new project starts ever, at over 6GWac.
Just as satellite data sometimes challenges the status quo, it can also sometimes lend confidence to consensus by providing independent validation.
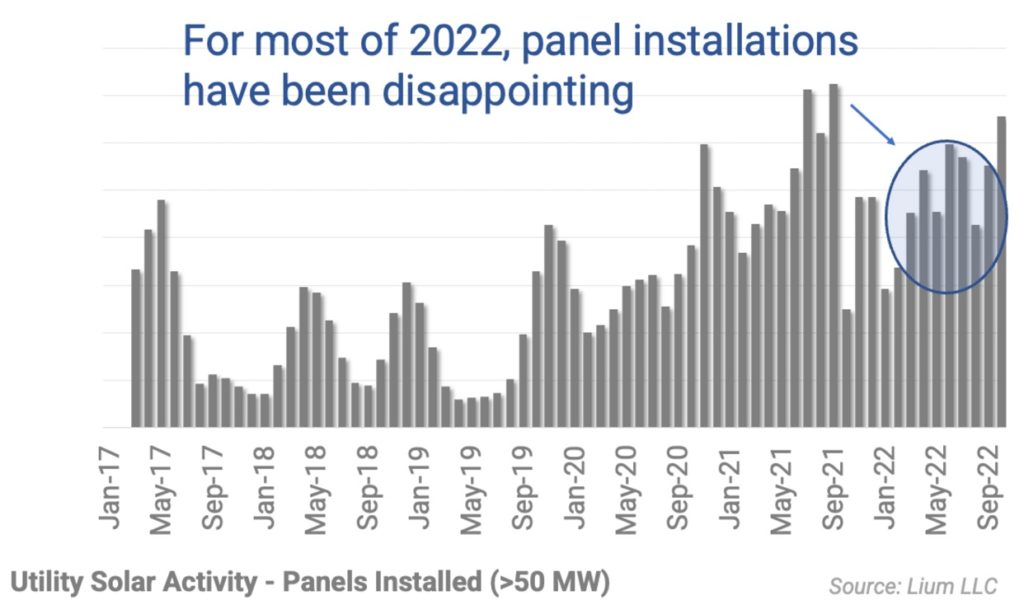
As an example of where satellite fact-checking showed the industry getting it right, solarSAT data tracking actual panel deliveries through the first half of 2022 was consistent with anecdotes and panel import data suggesting lower installation activity. In solarSAT data, the number of panels installed in the field for the first nine months of 2022 was down almost 20% compared to the same period of 2021. A key driver of these lower installations has been solar tariff and import friction, which solarSAT data can tie back to 3-4GWac related to projects with the most affected manufacturers.
Trends and outlook from solarSAT Data
One area where satellites have recently generated some valuable predictive data is the growing backlog of projects that have been finished at the field level but are not generating electricity yet.
Specifically, there is a huge list of US solar projects that have completed construction and are just waiting to flip the switch. Based on solarSAT data, almost 6GWac is essentially ready to go (construction complete, but not yet online).
This backlog is more than triple the <2GWac that was waiting for connection in early 2022 and 50% higher than the backlog at the same time in 2021. This is also much larger than US Energy Information Agency data that classifies only 1.5GWac as ‘construction complete, but not yet in commercial operation’.
Looking ahead, the prospects are bright for the large-scale US solar market. The Inflation Reduction Act has dramatically changed the energy landscape, the supply chain is working out the kinks and scaling up, and big solar projects will play a pivotal role in energy production going forward.
The data underpinning business decisions in the sector is becoming increasingly sophisticated, thanks in part to new ways to monitor projects, such as with satellites. As the industry grows from here, the eyes in the sky will be watching and what they tell us can help market participants work smarter and more profitably as the large-scale industry grows into a juggernaut.
Authors
Daniel Cruise and Joseph Triepke are partners at energy intelligence firm Lium Research. Each has more than 15 years of energy finance experience working in both buyside and sellside analyst roles. Daniel attended Texas A&M University, graduating with degrees in both accounting and finance, and is an alumnus of Jefferies, Evercore-ISI and Wells Fargo Securities. Joseph Triepke has a finance degree from UT Austin and previously held positions at Jefferies, JP Morgan, Guggenheim and Citadel.


