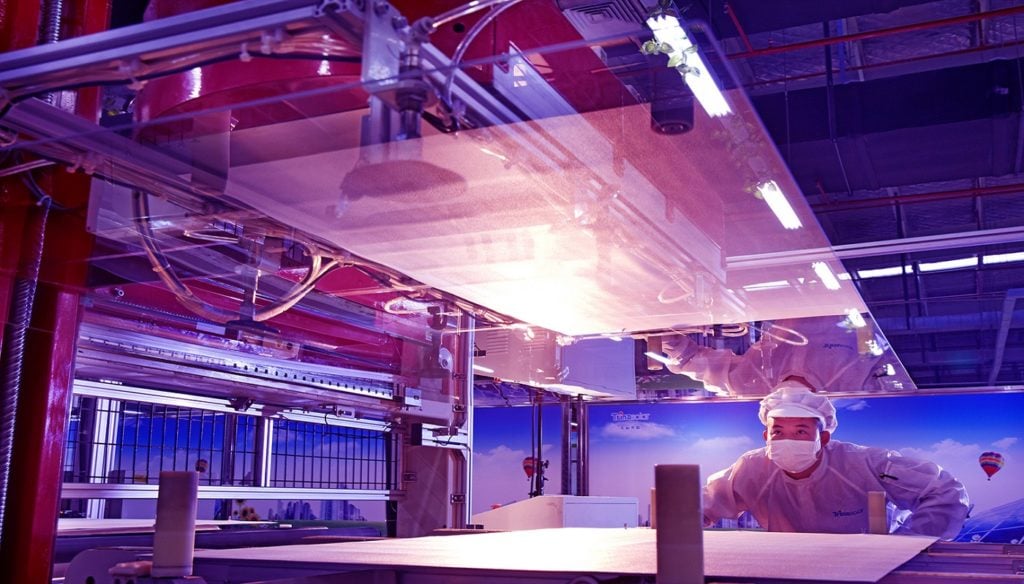
The solar PV industry produced more than 190GW of modules during 2021, as the industry went through its first major production-led supply cycle. This new dynamic – where end-market supply is driven by production constraints – is set to continue for the next couple of years until the inevitable over supply of raw materials by 2024 in China.
This article – using new analysis conducted in-house by the PV Tech Market Research team, and contained in the latest release of the PV Manufacturing & Technology Quarterly report – discusses why the industry has shifted towards a production-led dynamic, what the implications of this are for downstream module users, how legacy demand-based models are no longer fit for purpose and what it means now for accurate forecasting of the key trends that impact on company’s bottom-lines. Also, the contributions of the Top 10 and Top 50 module producers in 2021 are reviewed.
Try Premium for just $1
- Full premium access for the first month at only $1
- Converts to an annual rate after 30 days unless cancelled
- Cancel anytime during the trial period
Premium Benefits
- Expert industry analysis and interviews
- Digital access to PV Tech Power journal
- Exclusive event discounts
Or get the full Premium subscription right away
Or continue reading this article for free
A year of limited product availability, unprecedented demand and marketing noise
Like most things on the planet today, PV is a game of numbers. And this has never been the case more so than in 2021. In this context, the numbers of value have been firmly at the production level; not capacity, not false promises, not alleged force majeures justifying contract cancellations and certainly not numbers derived from market sizing levels now out of date and reflecting a somewhat youthful naivety of how the commercial world operates in practice.
It is sad today that very few people track in-house production through the value chain, looking at the 100-plus companies that make up 99% of everything produced (polysilicon for solar, wafers, cells and modules). This is perhaps not surprising; over the past decade, there has been a gradual withdrawal of companies in citing in-house production, far less shipments or PV-related quarterly/annual revenues. In most cases, the main reason for this is one of evasion; not wanting to show to the outside world that either the company makes little of its upstream components or – even worse – simply rebadges a PV module made by a different third-party entity.
Simply using shipments as a marker for market-size (which alone would be better than a top-down demand-based model) is also dangerous as you can quickly get into chronic double-counting; in particular counting the same module twice (once for the OEM supplier’s shipment, and again for the final end-market or merchant supply). Go upstream in the value chain from modules, and this issue also becomes apparent today at the cell production stage, especially since the likes of Tongwei and Aiko started to make such high levels of cell product for the Chinese c-Si ‘engine’.
The PV industry in 2021 was production-led. Basically, this means that end-market demand for modules outstripped production levels by some margin; such is the desire globally today for renewables, coupled with the large uptick in global corporates (and major utilities) rushing to hit 2030 sustainability-driven targets.
Checking on the ~190 GW figure
In a production-led climate, knowing what is produced (and shipped) through the upstream value chain is everything. In 2021, there was only one bottleneck – polysilicon. At no point was there any meaningful shortage arising from wafer, cell or module capacity. Everything depended on how much polysilicon was produced in China.
Thankfully, there were no incidents that impacted supply; at least ones that have arisen in the past from natural disasters or factory explosions, as has happened before and especially in 2020. Yes, there were ‘glitches’: the Xinjiang question; the curtailment reports out of China. But polysilicon production levels largely went as expected during the year.
In fact, when we looked at the market-size for 2021 back in January last year, it was already shaping to be a ~190 GW year. The only doubt was whether there would be a major outage at a key Chinese polysilicon plant (which was not to happen) or if the world would totally reject buying PV modules that were priced 10-15% higher than they had hoped for.
Media reports focused on the projects that were delayed; not so much on the sheer volume done. Again, why has it been so surprising in a production-led (supply-constrained) world that not everyone gets a product, or at the price they want? It was a seller’s market in 2021, especially if you were selling polysilicon (gating supply to the upstream segment) or modules (gating to the downstream).
Also, it is really a surprise that Chinese module suppliers prioritised their own market for much of H2 2021? Why export when domestic pricing is good, there is a government-stamped mandate to build plants and use domestic product and margins for shipping globally are less desirable? During H2 2021, China became a domestic ecosystem for production and deployment of solar; this simply left others globally as handicapped and/or prisoners to the short-term whims and tactics of suppliers they had become reliant upon in the past.
The best check on the 190GW figure is production of polysilicon (in tons) and then the other key part – knowing the g/W values through the year. Here, there was good news for downstream companies. The decline in g/W (i.e. how much polysilicon is needed for any Watt of module rated power) saw strong downward movement during the year; increased mono use as part of efficiency gains (power density at the module level), thinner wafers, and more densely packed cells on larger module formats. This basically offset the secondary glitches in polysilicon volumes (at the tonnage level), and allowed the 190GW level to be met by year-end.
The other numbers that have to be checked are inventory levels through the value chain. Here, there was really nothing of major significance. Had there been, pricing would have collapsed, especially at the poly level. There was no pricing collapse during the year through the value-chain: there was no major inventory builds at any stage. The only surplus was at the nameplate capacity level (wafers, cells, modules); and there is nothing at all new here when it comes the PV industry. By now, we should all have learned that capacity-adding is a somewhat futile exercise for wafers, cells and modules.
Top 10 consolidation or still an industry welcoming new names at the gigawatt-scale?
Every year for the past 15 years that I have been tracking PV manufacturing activities, the year always starts with proclamations about ‘this year being the year of consolidation’. It never really happens, and 2021 is a classic example of this. New entrants being bankrolled to have gigawatt-scale fabs (albeit dominated by Chinese RMB) still outweighs the companies that enter zombie-mode, get wound up, or are folded (in stealth mode) into the subsidiary operations of an existing industry player.
One example of this is shown in the figure below. Here I look at one of the most basic examples at the consolidation side: module production. Yes, over the past few years, there has been a larger part of module production (and by default module supply as the top module suppliers have less OEM produce than other module suppliers) assigned to the ‘top 10’ by production volume. But the growth levels are far from conclusive, and there are still more than 50 module suppliers that have a meaningful impact on production/supply volumes.
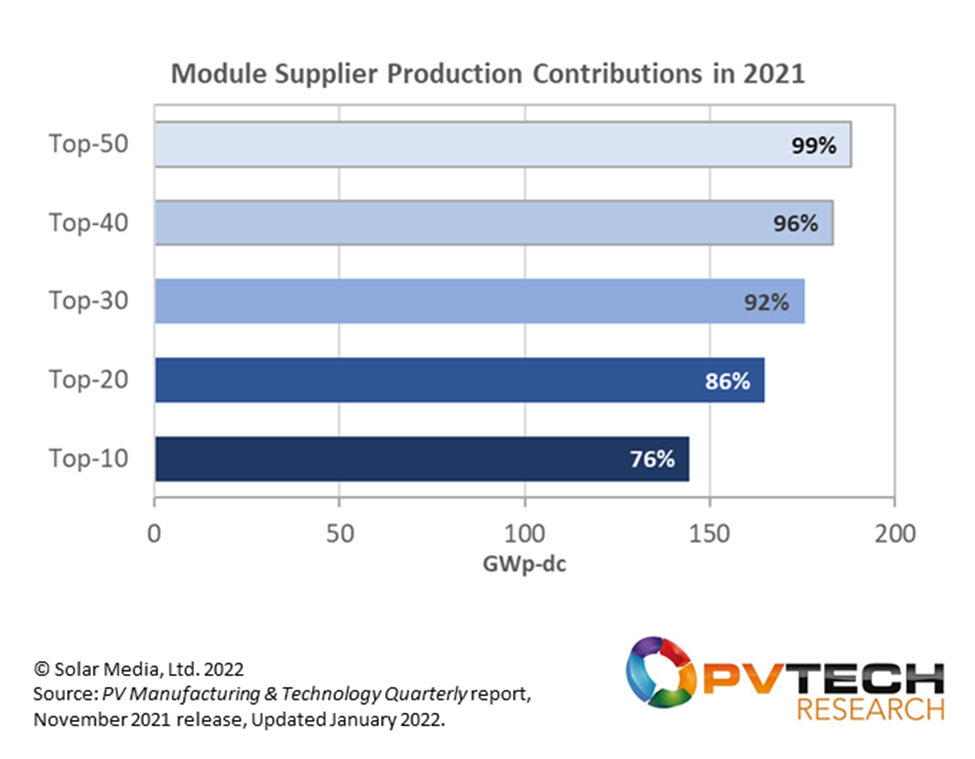
The graph above shows that the top 10 module producers accounted for 76% of all modules produced in the year. However, when looking at the shipment volumes from this top 10 grouping, this percentage figure IS a few points higher. This is because most of the c-Si companies in the top 10 have been relying on some form of third-party rebranding (from within China itself, across Southeast Asia).
It is only when you add up in-house production levels for the top 50 module producers that you get close to the 99% figure. This corroborates our narrative for the past couple of years that knowing the top 50 is essential, and not just the top 10. Indeed, if you have been a US-based buyer of modules in 2021, this statement should ring true. As many of the top 10 deprioritised US shipments (for a host or reasons), the hole had to be filled by many of the other module suppliers (within the top 50 list). Does this sound like consolidation? Quite the opposite in some ways.
Consolidation today is not so much at the module production/supply level, but for polysilicon, wafers and cells. This is why consolidation matters. Not as an academic company number-counting exercise, but from a risk perspective to the global sector. 2021 revealed this in abundance. Last year it was poly; next time around it could be wafers or cells, especially if there is a hunger for n-type products that can’t be met as quickly as needed. The global c-Si sector remains under the control of Chinese manufacturing, and there will inevitably be bumps in the road going forward – some good and some bad, depending on your focus.
Production-led in 2022; what does this mean?
Having dwelled somewhat on the past (last year), it is now time to move all discussion to 2022 numbers. Please – let’s not spend nine months in 2022 trying to work out what happened in 2021!
All talk now needs to be on supply/demand levels for 2022, capex, technology shifts, and module supply availability by company and manufacturing region. And not to forget of course, module ASP forecasts.
The landscape for 2022 will be covered in further blogs from me this month. In the meantime, to get direct visibility into all the numbers, trends, analysis and forecasting for PV manufacturing, please complete details on the landing page to our PV Manufacturing & Technology Quarterly report here.

")


