The latest findings from PV-Tech’s unique bankability analysis – the PV ModuleTech Bankability Ratings report – have now been completed, forming the basis of the Q3’20 rankings for leading global module suppliers. This article discusses the main findings of the new report.
In addition, I will show for the first time, extended bankability analysis undertaken that allows detailed benchmarking of all A and B grade module suppliers, across a range of financial and manufacturing metrics, and how real-time ‘report-cards’ can be generated on module suppliers revealing their relative strengths and weaknesses.
Try Premium for just $1
- Full premium access for the first month at only $1
- Converts to an annual rate after 30 days unless cancelled
- Cancel anytime during the trial period
Premium Benefits
- Expert industry analysis and interviews
- Digital access to PV Tech Power journal
- Exclusive event discounts
Or get the full Premium subscription right away
Or continue reading this article for free
While reading the feature below, remember that links to all the articles I posted on PV-Tech last year explaining the full methodology of the PV ModuleTech Bankability Ratings analysis can be accessed quickly via the hyperlinks here.
Number of A and B grade module suppliers now exceeds twenty
The overall company rankings, based on their individual Bankability scores, for Q3’20 are shown in the figure below.
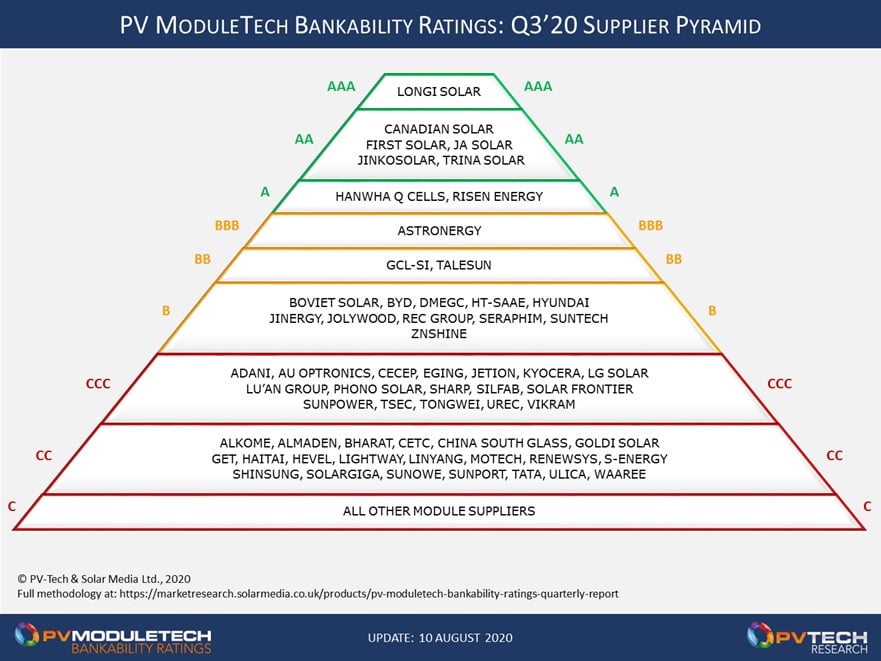
LONGi Solar continues to be the only AAA-Rated module supplier, largely because the company’s finances remain in a different league to all other companies shipping GW-plus product annually today. This is coming in part from gross/operating margins – even through 2020 – well above others, but almost regardless of the financial ratio/metric compared, LONGi Solar is either best-in-class or in the upper quartile.
The AA-Rated company grouping is now looking more stable, with Trina Solar and JA Solar re-listed (or back-door listed) in China. While JA’s private-status hiatus was rather short-lived (two years) it took Trina about four years and overlapped with a reset in the company’s positioning during 2017 and 2018 in particular.
China-listing clearly makes sense when seeking to invest in expanding in-house capacity needed to stay in control of manufacturing/production and costs. It should be remembered also that, aside from the US, there is really no strong motivation to add any new capacity outside China.
Of the eight A-Grade (AAA, AA and A-Rated) module suppliers, it is not inconceivable that 18 months from now, JinkoSolar will be the only Chinese-run/US-listed company. This assumes that Canadian Solar’s plans to carve out its manufacturing (upstream) business as a separate Chinese-listed entity come to fruition.
How things have changed for Chinese companies seeking to list in the US, compared to just five years ago.
Peer-group variance should dominate corporate KPI’s & success evaluation
For the last 15 years, one of the biggest challenges for the PV industry has been in benchmarking module suppliers; a situation made all the more difficult with 100-150 module suppliers generally in the mix at any given time. Not to mention a bunch of suppliers that don’t actually make any product, don’t exactly explain this to the outside world very well, and try sell a brand name to the market sometimes in competition with their OEM supply source!
It is definitely time for the PV industry to reclassify these companies as resellers, not module suppliers, in the same way that distributors don’t make products and just act as middle men. Or even just classify companies like Sharp and others as end-users of products. Perhaps, I will return to this in coming months, possibly in light of where the new SunPower/Maxeon entity may decide to position itself strategically.
Returning to simple benchmarking, it would be fair to say that peer-group benchmarking of leading module suppliers has been extremely limited, with capacity and shipment levels often forming the only comparisons.
During 2019, when we gathered all the manufacturing and financial data together (to allow the PV ModuleTech Bankability Ratings analysis to be done), it was clear that the ability to do benchmarking and rankings in an altogether new and enhanced way was possible.
Peer-group benchmarking is everything. Almost nothing else matters, when looking at company shipments, revenues, profits, earnings, debt, capex, R&D spending, assets, liabilities, technology roadmap, etc., etc.
It sounds incredibly simple and obvious, and indeed it should do. But the devil is in the detail. First, you need to know what constitutes a peer-group and which companies are members of this exclusive listing. Then you need to know a great deal about each company’s quarterly operations (financial, manufacturing), updated at least quarterly. And finally, you need a good command of statistics and analytical tools, coupled with the ability to understand and explain related graphical output.
The entire process that involved creating the PV ModuleTech Bankability Ratings was by default a peer-group allocation tool in its own right. Simply setting up boundary conditions between A, B and C-Graded scores, and further across the grade rating categories (e.g. AAA, AA, A for A-Grade), puts companies into levels occupied by their peers.
There are two clear options for doing peer-group benchmarking across PV module suppliers. One is to isolate the A and B-Grade module suppliers; a total of 22 companies. The second would be to reduce the number of module suppliers, comparing only A-Grade companies (a total of eight).
Essentially, this is done (whether for A/B or A only peer-group benchmarking) by taking the average of the peer group for any specific metric or ratio (e.g. US utility shipments, return-on-equity, manufacturing capex, US AD/CVD-free cell/module Southeast Asia capacity, etc.) and show the difference in each company’s value (the ‘variance’) from the average of the peer-group.
This variance is best expressed in percentage terms (how much over/under the peer-group average). For example, if the average utility shipment volume over a trailing three quarter period into Europe is 50MW, then a company shipping 150MW within this period has a variance score of (positive) 200%: conversely, a company shipping just 25MW has a variance score of -50% (i.e. negative).
This allows a couple of important things to be considered now. First, at any given point in time (end of last quarter, Q/Q, Y/Y or any quarter in the past), any module supplier company can be benchmarked against the average of the peer-group. This shows very quickly the areas where the company is performing better or worse than its main competitors.
It is effectively a quarterly-trending, external/third-party derived, corporate performance indicator, as it relates to manufacturing and shipping PV modules to commercial, industrial and utility segments globally.
Having developed the PV ModuleTech Bankability Ratings to allow ranking all PV module suppliers for non-residential (commercial, industrial and utility) deployment globally, it is now time to expand the ratings feature with extensive benchmarking analysis.
Put very simply, we have now created a tool to visualize the strengths and weaknesses of PV module suppliers, and how these change over time. The next section illustrates a couple of examples now.
Why AAA, AA & A-Ratings remain the gold standard of module supply
The entire methodology of the PV ModuleTech Bankability Ratings was underpinned by qualification as A-Grade rated being above 50% in a 0-to-10 scoring mechanism. Entry to this elite grouping by default demanded both multi-GW of shipments to non-residential PV segments, coupled with financial health that was in the ‘safe’ zones for PV sector longevity.
Companies that were shipping all product to residential segments score low (regardless of financial performance). Companies that are close-to or beyond technical bankruptcy score low also (regardless of their shipment volumes). Ultimately, the highest scoring (Bankable) suppliers should be the ones we see getting the lion’s share of the megasolar sized global utility-scale business.
To illustrate this now, we can look at one of the variance-derived peer-grouping graphics. Here, we isolate the PV ModuleTech Bankability score for Manufacturing. (Recall that the Bankability Score combines Financial Score/health and Manufacturing Score/health.)
The peer-group for this analysis consists of all A and B-Graded module suppliers (a list of 22 companies for Q3’20). Most of the peer-group variance studies are performed on a trailing three-quarter average basis, including the one shown below here for Manufacturing Score (health).
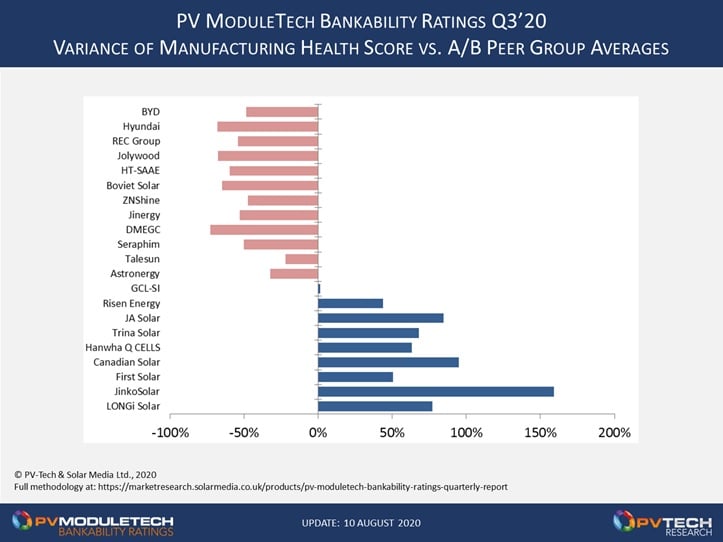
The above graphic is incredibly useful when looking at peer groups (in this case all A and B-Rated module suppliers). However, if you want to look at one company only and see how they compare to peers across a range of other parameters (not simply Manufacturing health), then a slightly different presentation is required.
To illustrate this, we have chosen Canadian Solar as a topical example. I will return to why Canadian is ‘topical’ in nature later in the feature: for now, let’s look at Canadian Solar’s Q3’20 ‘report-card’. Some of these metrics are shown in the graphic below.
To understand the graphic best, consider negative/red-coloured bars (to the left of the y-axis) to be ‘weaknesses’ in relation to the A/B peer grouping. Conversely, positive/blue-coloured bars (to the right) are ‘strengths’. The higher the variation percentage score, the greater the strength or weakness.
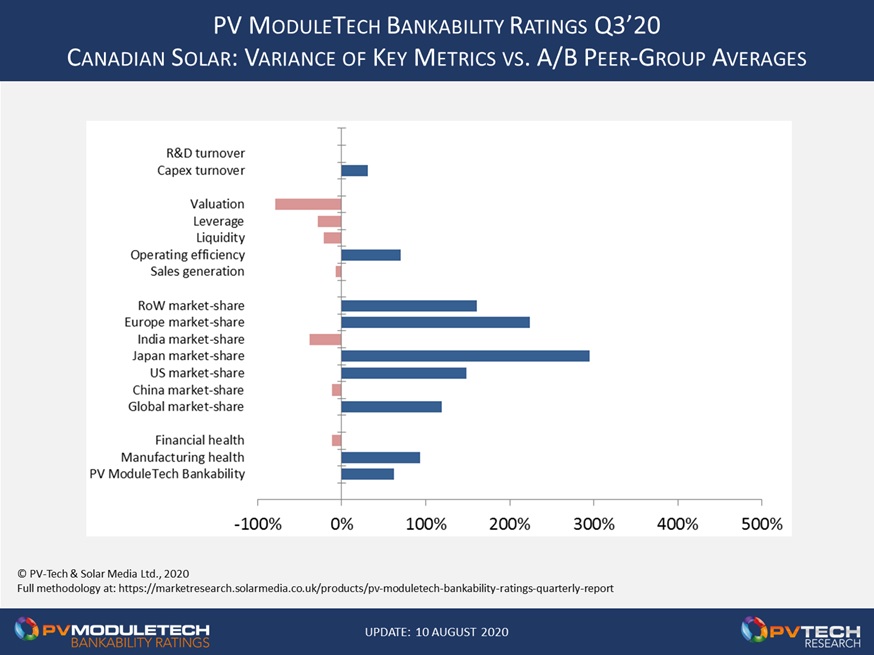
In the graphic above, we have separated some of variance scores into groupings. The lower three are top-level Bankability and its constituent factors (Manufacturing, Financial health). Then, working upwards, the next grouping shows market-share globally (commercial, industrial, utility) and within six countries/regions. (RoW has fleetingly been referred to by some as ‘emerging’.)
Above the market-share variances are a selection of financial terms/ratios. Much more will be communicated on these in coming months, as this continues to be one of the biggest challenges; pulling out ratios that allow differentiation and are meaningful from the perspective of a module buyer (as opposed to a stock-market investor/trader).
The final category at the top are brand-new metrics we have created to best understand what capex and R&D really means in the PV industry. Again, we will explain these more later. Essentially, companies score high if they are able to spend low on capex and R&D. Our ratios of capex and R&D turnover are key ones today, in a different way to a few years back; being frugal on spending here is a major plus, not a sign of caution.
Let’s try quickly to explain Canadian Solar’s play in the industry today, with reference to the above graphic. From bottom-to-top…
Manufacturing health is well above peer-average today, aided by capacity expansions/upgrades recently (in particular in Southeast Asia for US shipments less AD/CVD). Financial health is below-average (slightly), not because Canadian Solar is anywhere close to losing money or in trouble, but because various group entities controlling members of the peer-grouping (LONGi, First Solar, Chint Group, Hengdian Group, Boway Alloy, Hyundai Energy Solutions) have financial scores well above those of Canadian Solar today.
The market-share analysis above is a great way to see where the company has been successful in deploying resources recently. The focus has been the US, Japan, Europe and various RoW/’emerging’ regions. Japan has been the big winner for Canadian over the past couple of years, all the more interesting when considering the company’s somewhat reluctance to embrace the mono-mantra in terms of technology offerings.
The high score for US shipment market-share is somewhat a validation of the investments into Thailand over the past couple of years also.
Interestingly, the ‘negatives’ or ‘weaknesses’ in terms of market-share today are confined to China and India. To many, having minimal dependence on these two end-markets may in fact be seen as a positive. Collectively, China/India today are fraught with risks in terms of module supply.
Ideally, a Chinese-run module supplier should be aiming for fill order books with overseas shipments with the exception of India. Then, if need-be, domestic China shipments can be filled if needed. And if things are really bad, serving the Indian market is probably a last resort. Therefore, Canadian’s market-share scoring is extremely good compared to its competitors.
The next group of metrics are finance-specific, covering a range of ratios capturing revenue generation, profitability, short-term cash solvency, long-term debt and valuation. The choice of metrics or ratios here is much more complex, compared to simply comparing module supply market share, or indeed the overall financial health ranking that uses a prescriptive Altman-Z analysis as the basis. The key to choosing ratios here is driven by looking at variances in the operations across the peer-group chosen, rather than for example some of the metrics used to assess whether companies represent a good or bad short-term investment. A full explanation, including additional ratio benchmarking, is contained in the full quarterly PV ModuleTech Bankability report.
Across the peer-group here, it is clear that Canadian Solar’s operating efficiency (net profitability) is well above most of its competitors. For Canadian, this is actually coming from strong gross margins for its two main revenue streams; selling modules and selling short-term owned downstream assets. The company is almost unique today in the industry in this regard, and this is captured below also in regard to plans to carve-out the upstream part of its business.
The last two metrics compared are new ones created by our in-house analysis, and are based on capex and R&D spending. While there is often a belief that greater capex and R&D spending is something that shows leadership, within the PV industry this is far from the case. Let me explain this more before looking at Canadian Solar’s variance with respect to the peer-group.
R&D spending varies hugely across module suppliers, and has done for many years. Many companies have survived just fine by largely following technology trends introduced/developed by others, without having to prioritize in-house R&D spend. China is the perfect case-study in this regard. Others – most notably First Solar – have a necessity to invest in R&D as a result of being technology-differentiated. Over the past 10 years, there is a clear correlation between fleet panel average efficiencies and investment levels into R&D.
Our Capex Turnover metric compares module-specific revenues to capex invested into cell and module lines, and it a more granular method compared to looking at group revenues and overall capex across different parts of the PV value-chain or indeed capex into non-PV business units.
The goal is surely to maximize module revenues while minimizing capex levels. Right now, this is a massive deal for PV companies, in particular in China. Essentially a bang-for-your-buck, minimizing capex now while adding 10-20 GW of new cell/module capacity over the next 2-3 years is key. Today, this is exemplified by JinkoSolar and Canadian, and the fact that Canadian has a net-positive Capex Turnover ratio compared to the peer-grouping should not come as a surprise. Indeed, when we look at some of the peer-group players, some have far less ambitious capacity growth plans, making their Capex Turnover very high in the near-to-mid term.
R&D spending is more of a misnomer in PV, and this certainly includes also how companies define and report R&D spending per se. This is limited correlation between R&D investment figures when looking at, for example, US companies listed in the US and Chinese companies listed in China. The R&D Turnover metric is calculated in a similar manner to the Capex Turnover ratio. Canadian Solar’s return on R&D is aligned with the peer-group.
One of the reasons also for choosing Canadian Solar as the case-study for the new enhanced peer-group variance analysis is not just to see where the company has strengths and weaknesses today versus the other 20 A/B peer-group of suppliers, but to get a feel for what a ‘new’ China-listed manufacturing-specific Canadian Solar might look like.
While Canadian Solar’s module revenues (as a percentage of group turnover) are lower than the likes of JinkoSolar or JA Solar today, the company’s business is still heavily weighted to producing modules at low cost, and maximizing margins when selling modules. As such, many of the metrics underpinning Canadian Solar (as listed on NASDAQ) will be similar to those reported by the proposed China-listed entity.
However, the three areas where the company is below-par above (liquidity, leverage, valuation) are almost certain to be reset upon Chinese-listing. As such, we would expect to see an instant improvement upon listing, very similar to what was seen with Trina and JA Solar in the past 12 months.
The need for detailed Bankability analysis continues
Our decision to expand the PV ModuleTech Bankability Ratings analysis at PV-Tech was driven by the many requests from report users that have been starved of company-to-company benchmarking for many years. We are in the process of adding more features here. Ultimately, anything qualified and data-driven that can help developers, investors and EPCs understand the difference between module suppliers is gold dust.
Top of list now is doing the peer-group variance analysis, confined only to the A-Grade companies (top eight module suppliers today). This is perhaps a far more valued comparison, as these companies are the ones mostly dominating GW-scale contract supply business today. Expect to see the headline results here in a few weeks on PV-Tech.
To learn how to subscribe to the full PV ModuleTech Bankability Quarterly report, please follow the information as the weblink here.


")