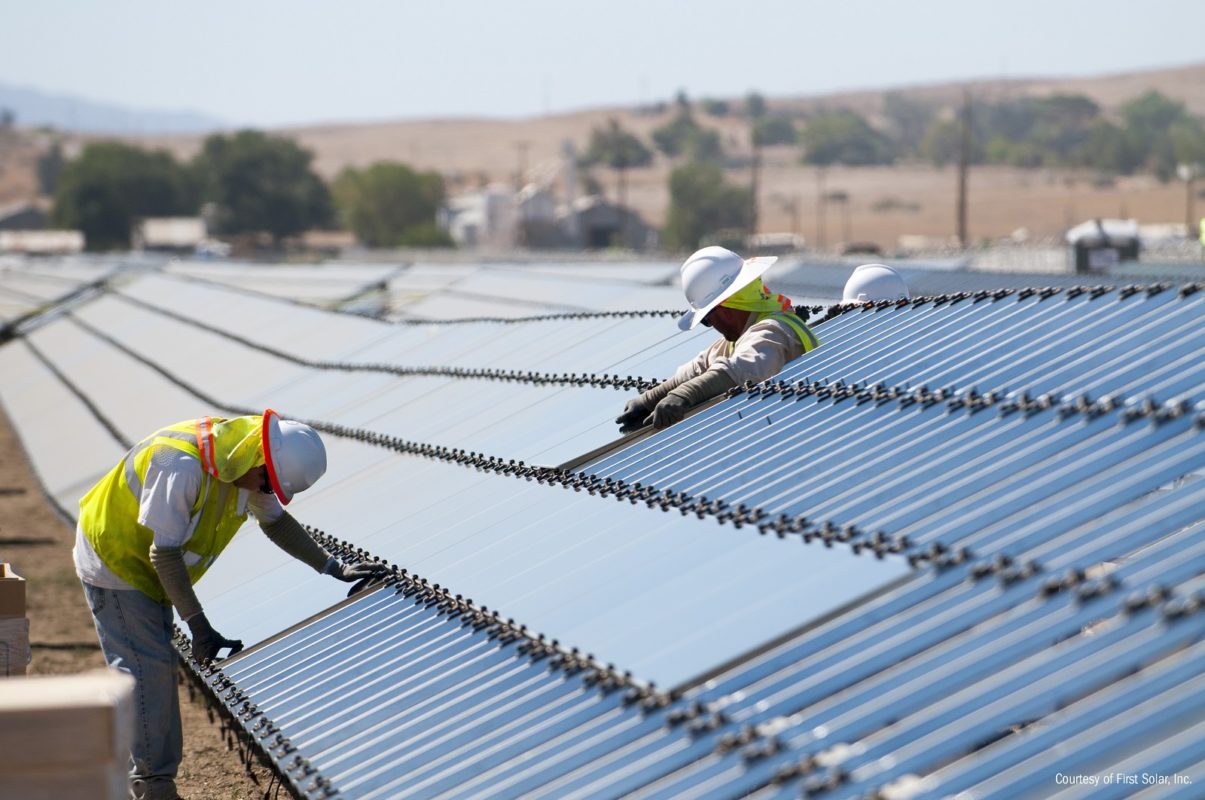
Reliability plays a critical role in PV’s cost competitiveness with traditional energy sources. Many research groups and institutions around the world pursue to quantify PV field performance, degradation and failures.
However, data sets studying a large number of systems that provide a high-level overview of issues occurring in the field are still difficult to find []. In response to the global financial crisis of 2008, US Congress enacted the American Recovery and Reinvestment Act in 2009 (ARRA). Section 1603 of ARRA gave qualified renewable energy projects the option to elect a cash payment in lieu of the federal investment tax credit (ITC).
Try Premium for just $1
- Full premium access for the first month at only $1
- Converts to an annual rate after 30 days unless cancelled
- Cancel anytime during the trial period
Premium Benefits
- Expert industry analysis and interviews
- Digital access to PV Tech Power journal
- Exclusive event discounts
Or get the full Premium subscription right away
Or continue reading this article for free
The award stipulated that annual PV production and comments relating to the performance needed to be reported. The data set comprised about 100,000 PV systems totaling to over 7 gigawatts (GW) direct current (DC) capacity or roughly 7% of the US fleet at the end of 2019. The insights gained from this data set provide valuable information of the performance and the state of reliability of the PV fleet in the USA. While the dataset is limited to systems in the USA the same lessons are more generic and may be applicable to other parts of the world.
Fleet performance
The data set consisted of annual production data for five years for each of the systems, the nameplate rating, an estimated production value and the location. The ratio of measured over predicted production could be calculated for all systems to assess system performance health. The data set is approximately divided into residential (1–25kW), commercial (25kW–1MW) and utility-scale systems (>1MW).
The division between groups is somewhat arbitrary but reflects the general trend between different types of systems, although individual systems at the respective limits may have been incorrectly classified. For systems over 5MW, in addition to the 1603 data, we generated our own production estimates using a separate data set acquired by the Lawrence Berkeley National Lab, which also included greater levels of detail on system specifics such as mounting configuration than was presented in the 1603 data. In general, we found good agreement between our own and the 1603 estimates, lending some credibility to the production numbers contained in the 1603 data set.
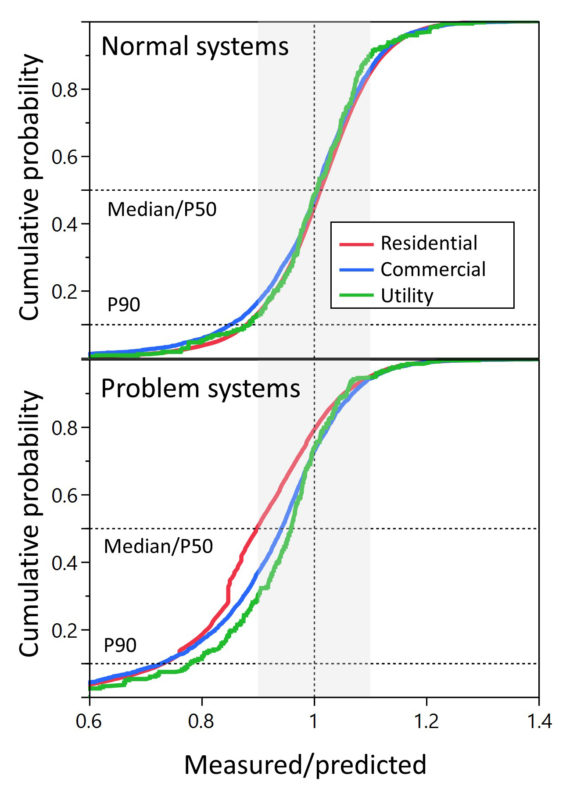
The five-year mean of the measured over predicted production ratio is displayed in Figure 1 as a cumulative distribution function (CDF). The advantage of a CDF compared to a histogram is that it more easily allows comparison of multiple large distributions.
The top graph shows all “normal” systems, i.e. systems that were not knowingly impacted by some issue. The data are colour-coded by the size of the systems and the median or the P50 is indicated by a black horizontal dashed line, as is the P90 that is often used in financial models.
The unity value, i.e. systems performing as expected, is indicated by a vertical dashed line together with a grey 10% band around it. At the median, the CDFs of the “normally” operating systems show slightly higher production than expected. In addition, the utility-scale category exhibits a tighter distribution, indicated by a steeper curve, is most likely aided by closer supervision in the planning and operation phase and/or more accurate predicted values. The P90 value falls between 0.8 to 0.9; in other words, 90% of all systems produce approximately within 10% of the expected production.
The general asymmetry of the CDFs indicates the limited upside of the production ratio, but the much greater risk for energy loss. A minority of systems greatly underperform and overperform, clearly indicating a problem with the system, production estimate, or reporting. However, because no comments regarding the performance were entered, these systems had to be treated as “normally performing” systems and are included. An additional source of uncertainty might be the difference in accuracy of revenue grade meters typically used in utility-scale systems compared to standard meters more commonly used in residential applications.
The bottom graph of Figure 1 shows similar CDFs of systems that were impacted by specific issues in any of the five-year reporting period. Similar to the “normally” operating systems, some systems greatly under- and overperform because of the different impact of certain issues on performance. However, some general observations can be made: utility systems show a reduced performance at the median compared to “normal” systems, but they perform substantially higher than residential systems. This is a difference that we will explore in more detail below. Commercial systems fall between the utility systems (similar performance at the median) and the residential systems (similar performance at the P90).
This is an extract of an article first published in Volume 24 of PV Tech Power. The full article can be read here, or in the full digital copy of PV Tech Power 24, which can be downloaded via the PV Tech Store here
References
[[1]] J. Leloux, L. Narvarte, D. Trebosc, “Performance Analysis of 10,000 Residential PV Systems in France and Belgium”, 26th European Photovoltaic Solar Energy, Hamburg, Germany, 2011.


