With numerous markets reporting problems with overly optimistic P50 estimates, attention has also been drawn to similar issues with PAN files. TÜV Rheinland’s Yating Zhang and Christos Monokroussos discuss the subject at length.
In both PV research and application areas, people are familiar with PVsyst software which is commonly applied to assess and forecast the energy performance of PV modules and arrays. The simulation results of PVsyst will further influence the financial investment of PV systems.
Try Premium for just $1
- Full premium access for the first month at only $1
- Converts to an annual rate after 30 days unless cancelled
- Cancel anytime during the trial period
Premium Benefits
- Expert industry analysis and interviews
- Digital access to PV Tech Power journal
- Exclusive event discounts
Or get the full Premium subscription right away
Or continue reading this article for free
An energy yield boost of 1% or 2% may bring several million or more revenues for a large system. Therefore, people are realising that the accuracy of PVsyst simulation results is worthy of much attention. Apart from accuracy related to the in-build simulation models and methodology, the accuracy of input parameters for each PV module, the so-called PAN file, results in major discrepancies between simulated and actual energy yield.
The users report that there are many overly optimistic PAN files, and these PAN files lead to overestimated energy yield, which finally increases the risk of investing and trading in the PV area.
Among the input parameters of PAN files, some characteristic data such as STC results, low-light data, incident angle modifier (IAM), temperature coefficient (TC) and light-induced degradation loss (LID) need to be measured according to relevant standards.
For the occasion that the measurement data are not available, some can be retrieved from PV modules’ datasheets, which are based on measurements that the manufacturer has performed and some default values of these performance parameters are provided by PVsyst.
The first tend to overestimate PV modules’ performance, while the latter are empirical values concluded either from the theoretical model or measurement results of a significant amount of PV modules. To accurately deal with PAN files, there are several considerations:
1) clarifying the source of input parameters, whether the input parameters are provided by a certified and reputable test laboratory or default values for PVsyst; a reliable source of PAN file input parameters is the base to ensure the accuracy of the simulation results;
2) understanding the definition of each input parameter, such as the series resistance or shunt resistance used in PAN files; the series and shunt resistance are relatively sensitive parameters and whose values may depend on their definition and extraction methods.
In other words, it means that the extracted series resistance or shunt resistance may be correct, however, they may not be the best choice to fit in the modelling methods used in PVsyst. The optimal series resistance or shunt resistance values for PAN files should be extracted from the one-diode model and further optimised through efficiencies under various irradiances to ensure that the accuracy of energy yield prediction is acceptable.
In the following sections, the definition of some important input parameters for PAN files and the comparison of simulation results between using measured and default input parameters will be explained in detail.
Low-light data
It is known that the PVsyst is modelling PV module performance based on the one-diode circuit model with five unknown parameters (photocurrent, diode inverse saturation current, series resistance, shunt resistance and diode quality factor), and the obligatory input data for determining these unknown parameters are the electrical parameters under STC (short-circuit current, current and voltage at maximum power point and open-circuit voltage).
Under the condition where only STC data are available, operators can only choose the default values of series and shunt resistance, the setting method of which is deduced by PVsyst. The low-light data is an optional input data; nevertheless, it gives essential information about the electrical performance of PV modules under low irradiance and can help optimise the series resistance and shunt resistance according to the actual characteristics of PV modules under various irradiance conditions.
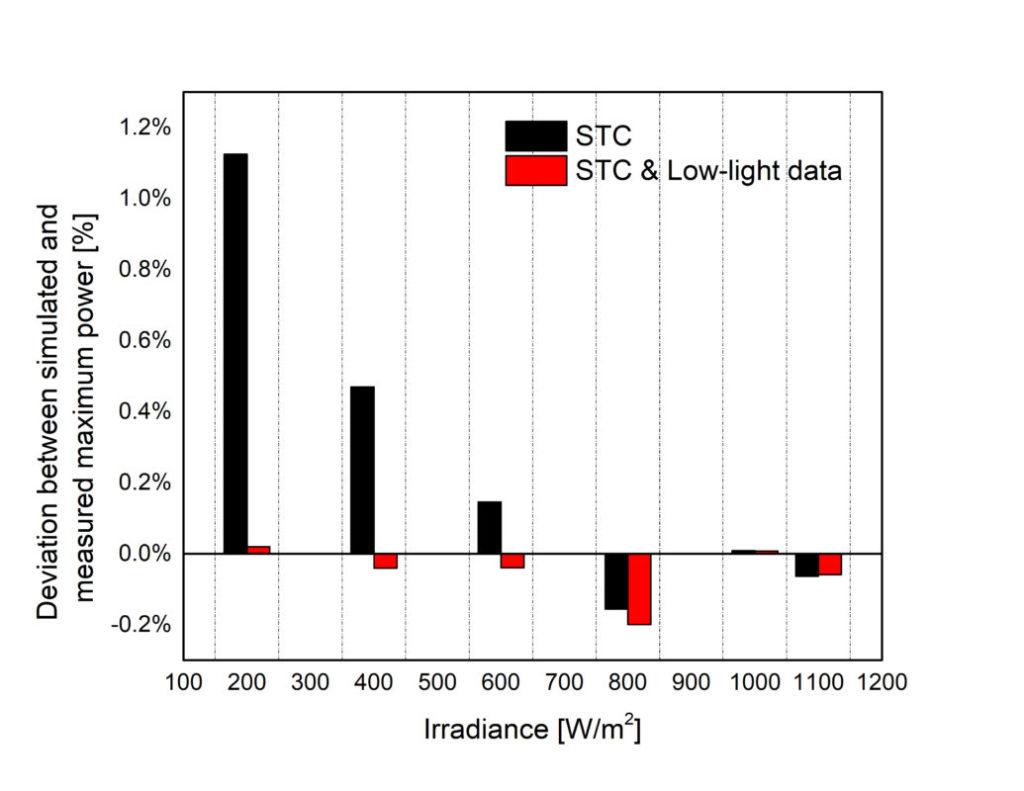
Under different irradiance, the comparison of simulated maximum power values of one mono c-Si PV module extracted with and without low-light data is shown in Figure 1, and the measured maximum power under the corresponding irradiance is the benchmark to estimate the accuracy of simulated maximum power. Some deviations within 0.2% exist for the simulation results extracted with low-light data included. However, it is obvious that the accuracy of simulated maximum power gets worse without inputting low-light data, and simulating deviation as large as 1.1% was observed for the irradiance of 200W/m2.
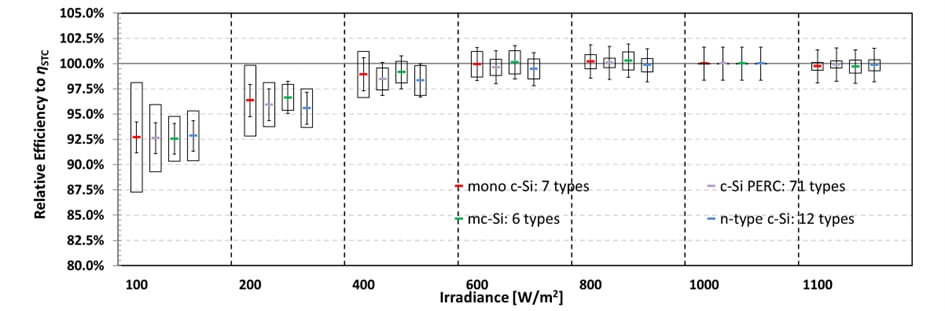
This simulating deviation may vary with the PV module type, as different PV modules exhibit distinguishable low-light performance. Figure 2 shows abstractly the comparison of approximately 100 PV module types in terms of relative efficiency with the performance at STC as a reference. The results showed that the relative efficiency losses associated with low irradiances below 400W/m2 were observed for all PV types. Even for the same technology group, the variability in the relative efficiency of PV modules can be significant specifically for the low irradiances, with standard deviation of technology variation varying from 2.23%, k=2 for mc-Si PV modules to 5.43%, k=2 for mono c-Si PV modules at 100 W/m2.
Incident angle modifier
IAM is another optional input data for filling the PAN files. When PV modules operate outdoors, they are subject to diffuse angular profiles that may introduce significant optical losses. The power losses due to incidence angles were to be at least 3% for a PV station every year [1, 2]. Since the optical losses are affected by many factors, such as inactive materials (glass or EVA), or the SiNx covering solar cells, the IAM is a unique characteristic for each PV module product. Hence, inputting the measured IAM for each PV module is recommended for increasing the accuracy of the simulation. For the case without measured IAM, PVsyst also provides several sets of default IAM values varied by the type of front surface of PV modules.
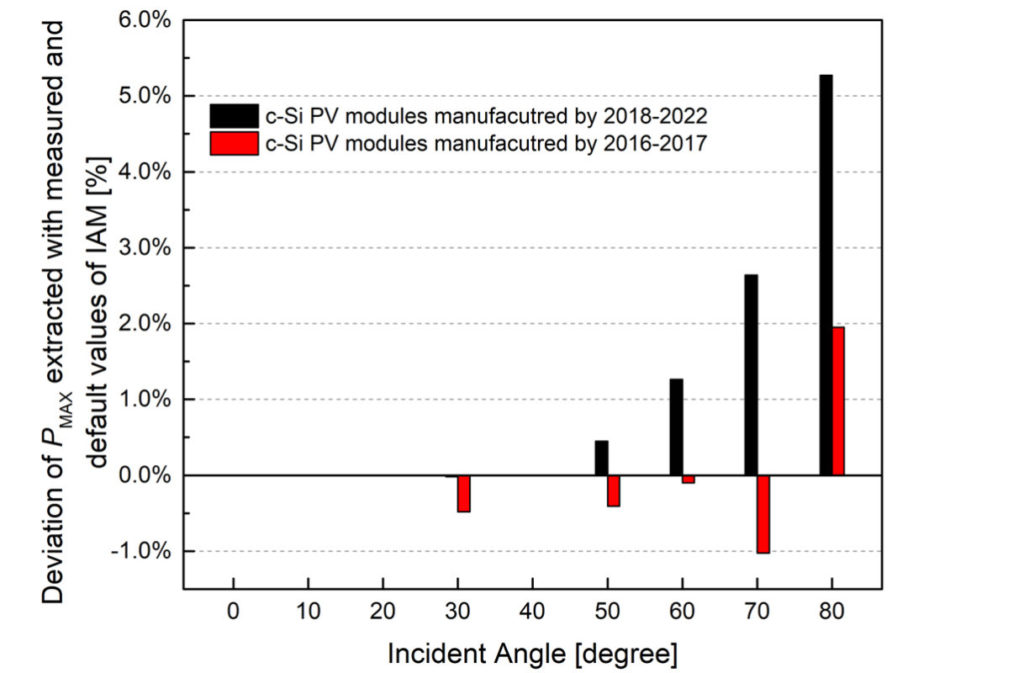
Figure 3 shows the discrepancy of simulated maximum power (PMAX) extracted with measured and default values for the AR coating surface. The measured IAM was counted from the measurement data of around 100 c-Si PV modules, and they were additionally sorted by the manufacturing year. The IAM test was performed in the ISO/IEC 17025 accredited PV laboratory of TÜV Rheinland in Shanghai according to the relevant contents in IEC 61853-23 [3]. As Figure 3 shows, there is an increasing tendency of maximum power deviation along with the incident angles. The maximum deviations are around 5.0% and 2.0% for the PV modules manufactured by 2018-2022 and 2016-2017 respectively. This means when the incident angle is 80°, approximately 5.0% power output may be underestimated by using the default IAM for PVsyst. It is also observed that the default IAM is relatively conservative compared with the actual IAM of PV modules manufactured in recent years, so the default IAM for PVsyst should be optimised to match the latest development of PV technologies.
Temperature coefficient
A photovoltaic module in the field is rarely working at a constant temperature. Most of the incident solar energy which fails to be converted into electricity dissipates as heat, leading to an increased module temperature and worsened performance. Temperature coefficients are measured to characterise the effect of thermal behaviour on the performance of PV modules, and they can be further applied to predict the energy output of PV modules under various temperature conditions.
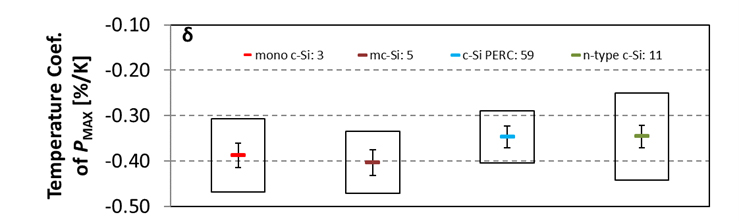
Generally, the temperature coefficients are specifically sorted into the temperature coefficient of ISC, VOC and PMAX. The temperature coefficients of VOC and PMAX are normally negative, while the opposite condition for the temperature coefficient of ISC. According to a significant amount of measurement results of c-Si PV modules, the temperature coefficient of ISC mainly distributes between 0.02%/ºC and 0.07%/ºC, and the range of temperature coefficient of VOC and PMAX are [-0.35, -0.25]%/ºC and [-0.48, -0.25]%/ºC respectively [4]. The temperature coefficient of PMAX is taken as an example here. Figure 4 shows the temperature coefficients of PMAX for 78 c-Si PV modules measured in the ISO/IEC 17025 accredited PV laboratory of TÜV Rheinland in Shanghai.
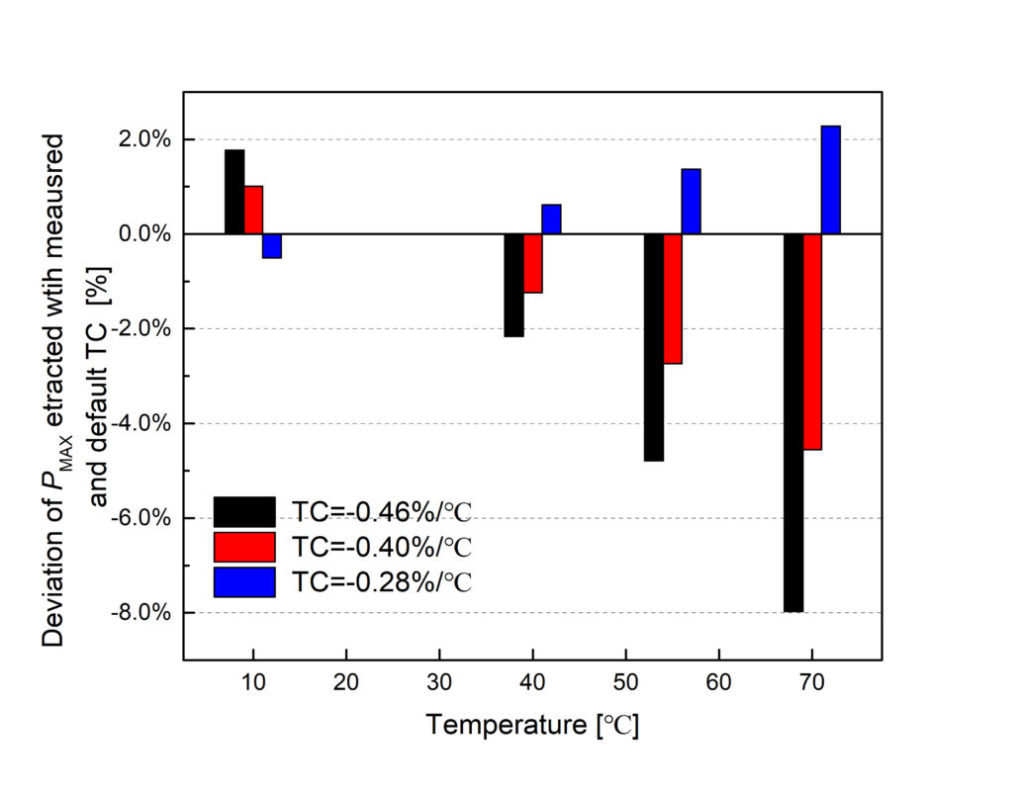
Based on the one-diode model for PVsyst, the effect of temperature factor on the power output is projected to the transformation of photocurrent and diode inverse saturation current along with temperature. The muIsc defined as the temperature coefficient of ISC in PVsyst is set for the temperature correction of photocurrent. The muPmpp defined as the temperature coefficient of PMAX can either be specified by the user or set with the default value for PVsyst. Based on the input muPmpp, the temperature correction factor on diode quality factor (muGamma) would be deduced automatically by PVsyst, and then be applied to simulate the inverse saturation current under various temperatures. The default temperature coefficient for PMAX of c-Si PV modules is -0.32%/ºC. Figure 5 shows the deviations of maximum power extracted with measured and default temperature coefficient of PMAX. The maximum power discrepancy increases along with the magnitude of temperature deviation from 25ºC, and it may be as large as 8% for the temperature of 70ºC. Even for the muPmpp of -0.28%/ºC which is similar with the default muPmpp value, the deviation of maximum power can increase to around 2% for the temperature of 70ºC.
Light-induced degradation loss
Light-induced degradation (LID) refers to a performance and power loss of solar cells due to the excess carrier injection by illumination or forward biasing [5, 6]. Most industrial c-Si solar cells and modules are suffering from some type of LID. In PVsyst, the LID loss is one type of array losses in PV systems and specified to analyse the PV array losses.
The LID phenomenon has been studied for four decades since it was first observed in Czochralski-grown c-Si devices in the 1970s [7]. Several LID degradation types have been observed such as boron-oxygen complex activation (BO-LID), Copper-related (Cu-LID), iron-boron pair dissociation (FeB-LID) and mc-PERC LID [8-10]. Among these degradation types, BO-LID is the most recognised degradation effect, which is usually observed in clean boron-doped Cz-Si. In recent years, gallium has been introduced as a dopant instead of boron, which results in lower LID losses. In contrast to the degradation caused by light exposure, a metastable relative efficiency increase appears in HJT solar cells with doped a-Si:H/c-Si structures under light soaking [11].
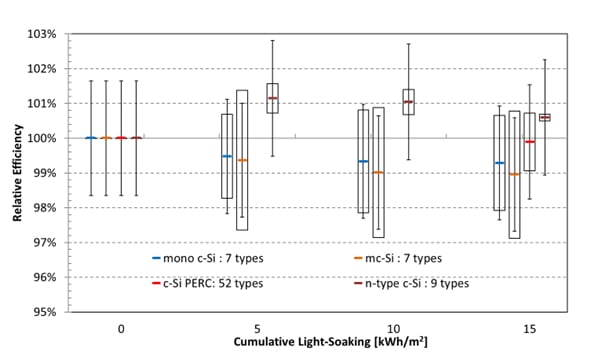
The results of relative efficiency (to initial) against cumulative irradiation dose for different module types at STC are illustrated in Figure 6. The relative efficiency losses of all the PV modules due to LID stays within 3.5% after light soaking of 15 kWh/m2. Mono c-Si, mc-Si, and c-Si PERC samples showed an average LID of 0.70%, 1.10%, and 0.11% respectively. N-type c-Si samples, the majority of which are HJT technologies with n-type Cz-Si wafer, showed an average 0.60% relative efficiency increase. The standard deviation within technology groups was calculated as coefficient of variation (CoV). It is worth noting that the module-to-module variation within certain technology was more significant than the difference between technology types except for n-type c-Si types. This indicates that even for similar technology types, large dispersion would exist due to both wafer quality and manufacturing processes employed.
Summary
The PAN files for PVsyst integrate most characteristics of PV modules that are necessary for energy yield prediction under different climatic conditions. Nowadays, a significant amount of PAN files, which are widely used in the industry contain inaccurate information, which is overly optimistic of the actual PV module performance. In order to acquire accurate PAN files, there are some suggestions below.
Firstly, understanding the modelling strategy and how input parameters are defined is a fundamental step. Secondly, the performance measurement of PV modules should be performed according to relevant standards such as IEC 61215-1 [12] and IEC 61853-1,-23, [13]. Thirdly, it is recommended that tests are performed by an accredited and reputable laboratory.
Lastly, it is suggested to have a third-party organisation performing regular surveillance for PAN files information. A third-party organisation can help check the accuracy of PAN files, and if necessary, sample PV modules and carry performance characterisation to verify the accuracy of input parameters.
References
[1] N. Martin, and J.M. Ruiz., “Calculation of the PV modules angular losses under field conditions by means of an analytical model”, Sol. Energy Mater. Sol. Cells, 70 (1), 2001.
[2] M. Schweiger, W. Herrmann, A. Gerber and U. Rau, “Understanding the energy yield of photovoltaic modules in different climates by linear performance loss analysis of the module performance ratio”, IET Renew. Power Gener., 11: 558-565.
[3] IEC 61853-2: 2016, Photovoltaic (PV) module performance testing and energy rating – Part 2: Spectral responsivity, incidence angle and module operating temperature measurements.
[4] C. Monokroussos, Y. Zhang, Eleanor W. Lee and et al., “Energy performance of commercial c-Si PV modules in accordance with IEC 61853-1, -2 and impact on the annual specific yield”, EPJ of Photo., to be submitted.
[5] H. Hashigami, Y. Itakura, T. Saitoh, “Effect of illumination conditions on Czochralski-grown silicon solar cell degradation”, J. Appl. Phys. 93, 7 (2003).
[6] J. Knobloch, S.W. Glunz et al., “Solar cells with efficiencies above 21% processed from Czochralski grown silicon” in Proceedings of 25th IEEE Photovoltaic Specialists Conference, 1996, pp.405-408.
[7] R.L. Crabb, “Photon induced degradation of electron irradiated silicon solar cells”, in Proceedings of 9th IEEE Photovoltaic Specialists Conference, IEEE, Silver Springs, MD, USA, 1972, pp. 243-249.
[8] B. Sopori, P. Basnyat, S. Devayajanam, S. Shet, V. Mehta, J. Binns, “Understanding Light-Induced Degradation of c-Si Solar Cells”, J. Appel in Proceedings of 2012 IEEE Photovoltaic Specialists Conference, Austin, 2012.
[9] T. Luka, C. Hagendorf, M. Turek., “Multicrystalline PERC solar cells: Is light-induced degradation challenging the efficiency gain of rear passivation?”, Photovolt. Int. 32 (2016), pp. 37-44.
[10] K. Ramspeck, S. Zimmermann, H. Nagel, A. Metz, Y. Gassenbauer, B. Birkmann, “Light Induced Degradation of Rear Passivated mc-Si Solar Cells”, A. Seidl., in Proceedings of 27th European Photovoltaic Solar Energy Conference and Exhibition. Frankfurt, 2012.
[11] E. Kobayashi et al., “Light-induced performance increase of silicon heterojunction solar cells”, Appl. Physics Letters, 109(15), 2016.
[12] IEC 61215-1: 2016, Terrestrial photovoltaic (PV) modules – Design qualification and type approval – Part 1: Test requirements.
[13] IEC 61853-1: 2011, Photovoltaic (PV) module performance testing and energy rating – Part 1: Irradiance and temperature performance measurements and power rating.
Authors
Yating Zhang serves as project manager in R&D Solar & Commercial Products of TÜV Rheinland Group. Yating is mainly responsible for the development of measurement methods of new PV technologies and performance evaluation of PV modules. She received her PhD degree from Shanghai Institute of Microsystem and Information Technology (SIMIT), Chinese Academy of Sciences, Shanghai, China.
Christos Monokroussos serves as global head of solar and is responsible for the global competence centre for solar and R&D in the TÜV Rheinland Group. Christos’s activities in TÜV Rheinland focus on the characterisation of solar cells and PV modules, PV module reliability and standardisation progress. Christos earned his doctorate degree in photovoltaics at the Centre of Renewable Energy Systems Technology (CREST), Loughborough University, UK.


