The wait is over, and the counting has been finished by our research team. The size of the UK solar market in the first quarter of 2016 can now be revealed and analysed in detail.
All through this week, we have been discussing the factors that were behind what was truly a fascinating quarter of solar activity in the UK. One that confounded the sceptics (several highly respected global companies had been vocal about the UK only adding 750MW in the first quarter), disappointed the eternal optimists (‘the UK will install 2GW in Q1’), but satisfied most of the companies serving the ground-mount sector.
Unlock unlimited access for 12 whole months of distinctive global analysis
Photovoltaics International is now included.
- Regular insight and analysis of the industry’s biggest developments
- In-depth interviews with the industry’s leading figures
- Unlimited digital access to the PV Tech Power journal catalogue
- Unlimited digital access to the Photovoltaics International journal catalogue
- Access to more than 1,000 technical papers
- Discounts on Solar Media’s portfolio of events, in-person and virtual
With all said and done, the UK ended up adding 1.553GW of new solar PV capacity during the three months to 31 March 2016, making it the second highest quarter ever in the UK for solar PV deployment.
In comparison to historic activity, this represents approximately 97% growth Q/Q, a decline of 38% Y/Y, and the third consecutive quarter of growth since the start of the FY 2016 fiscal period.
While at first glance, it would be easy to latch onto the 38% Y/Y decline as the leading indicator of quarterly action. And by no means, would this knee-jerk reaction be misplaced or brought into question.
For the UK solar industry has, since May 2015, been bashed into submission by a non-coalition based returning government that – quite frankly – simply had enough of developers and investors taking advantage of incentives that were not in the game plan of the government’s key stakeholders of today.
In fact, this only makes the numbers from Q1 2016 all the more incredible, and is testimony to the solar industry in the UK, but largely stemming from activity on the ground and some brilliant work done by planners and EPCs.
The figure below shows the breakdown of solar PV added through the UK’s fiscal year period to the end of March 2016, showing that a total of 2.939GW was added. This is down by almost exactly 1GW from the 12 months to 31 March 2015, when fiscal year additions were 3.926GW.
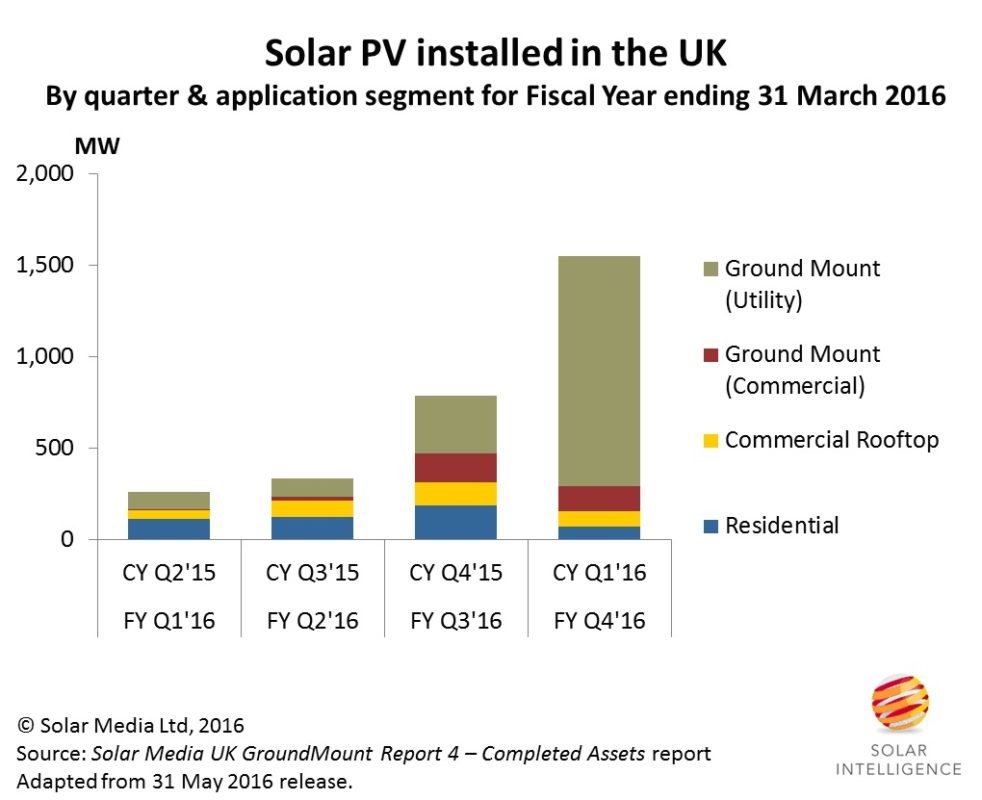
The UK added 1.553GW in Q1 2016, making it the second largest quarter of solar PV additions seen to date, but down 38% year-on-year as the effects of policy changes started to impact the industry.
The decline in FY 2016 by approximately 1GW is mainly a result of changes to solar industry conditions for ROC qualification, resulting from changes announced May 2014 and July 2015. The true effects of changes to FiTs will not be exposed until FY 2017 data is compiled fully, although the decline shown in the graph above for the residential segment in Q1 2016 is a clear indicator of what is to come.
As we stack up the quarterly additions since the start of 2010, we can see that the UK has comfortably gone through the 11GW mark in Q1 2016. See the figure below.
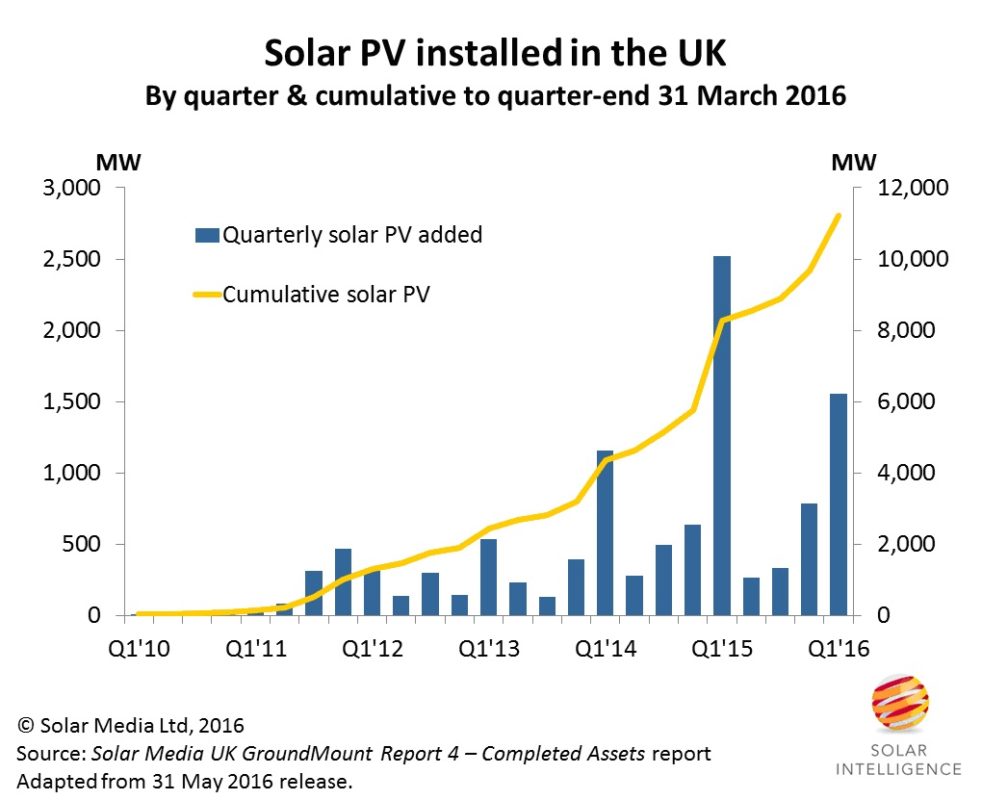
Q1’16 was the second largest quarter for the UK solar industry, with the GW-decline compared to Q1’15 coming mainly from government changes to RO qualification criteria from May 2014.
While we have been discussing many of the trends in the industry during Q1 2016, another interesting highlight was the fact that over 570MW of the 1.553GW installed in Q1 2016 was from >5MW sites that were grandfathered from the May 2014 changes in legislation. In the 12 months to 31 March 2016, more than 700MW was built on the ground that dates back to planning applications that started back in 2011-2013 and were submitted prior to May 2014.
In terms of the large installs qualifying for 1.3ROCs, there were two sites built >50MW in size, four in the 40-50MW band, two of size 30-40MW, two at 20-30MW, nine in the 10-20MW range, and eight in the 5-10MW category. Therefore a total of 27 large-scale solar farms was completed in the quarter, and went a long way to getting the UK to above 1.5GW of installed capacity.
Incredibly though, there were more than 150 separate installations of solar farms of size 4-5MW, making the quarter (by site build) just about the most manic of all quarters yet witnessed in the UK. If you are in the market today for a few 5MW sites to fill your 20MW portfolio, you should not be finding it hard looking for sellers! If so, please get in touch as soon as possible.
Indeed, if we look at all the completed sites above 2MW in size (there are almost 200 of them), hardly any of these match the original planning application size. Most were changed to increase the capacity (hence the 72MW largest site build done in the UK), downsized to get to 4.99MW, or carved up to allow for community-based solar activity. Planners in the UK certainly had their work cut out for them during FY 2016.
As we move forward to the end of Q2’16, and we are almost three months through the FY’17 period to 31 March 2017, we can see a range of different tactics and strategies being employed in the UK. During July, we will be analysing in detail ‘What’s left in the ROC pot’, as the UK solar industry begins its final 6-9 month push to get as many 4.99MW sites built under 1.2ROCs before the end of the RO scheme on 1 April 2017.
For those wanting to see the projects left for the UK solar industry, their status, who owns the SPVs, and much more, please contact John Browne at Solar Media Ltd., and ask about getting access to our Report 3 – Opportunity Pipeline report, which has updates issued every two weeks based on the daily research uncovered by our in-house team, and is the definitive guide for anyone looking to win business on new solar farm activity before the ROCs are gone.
