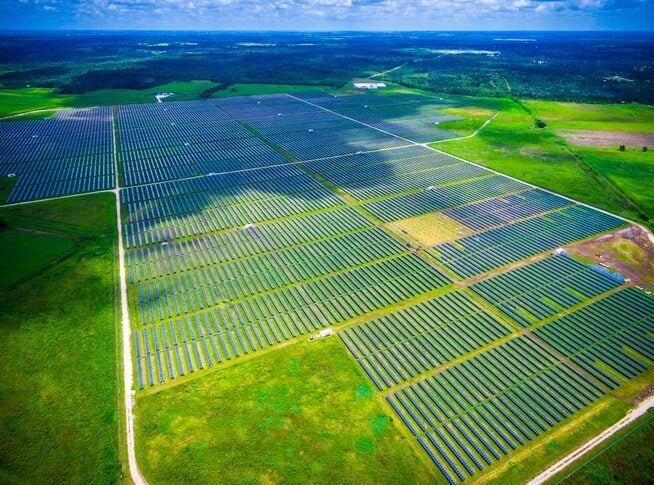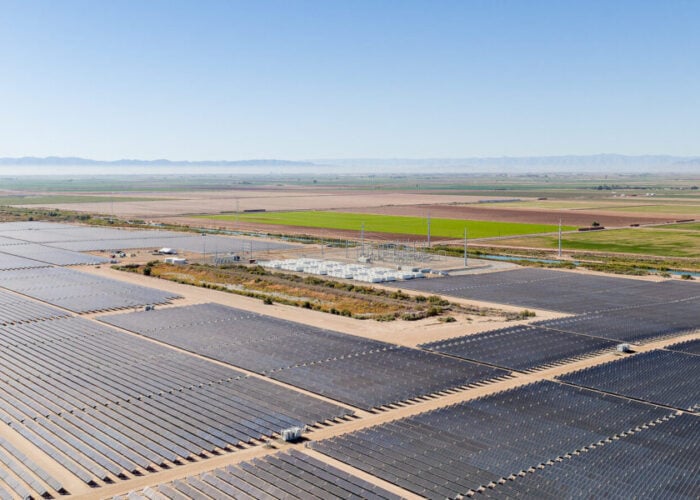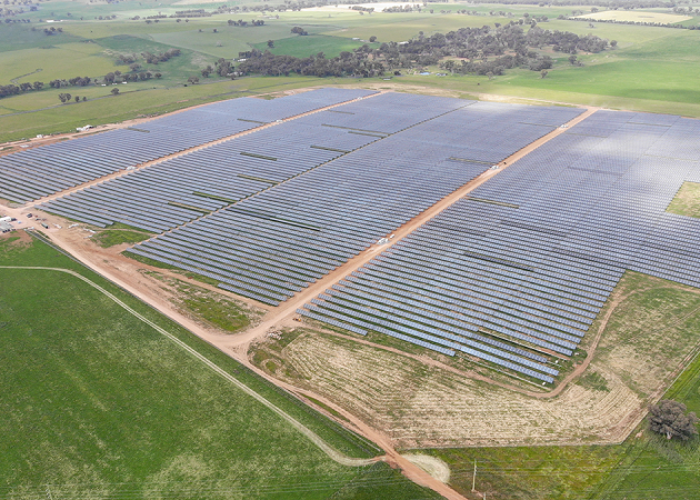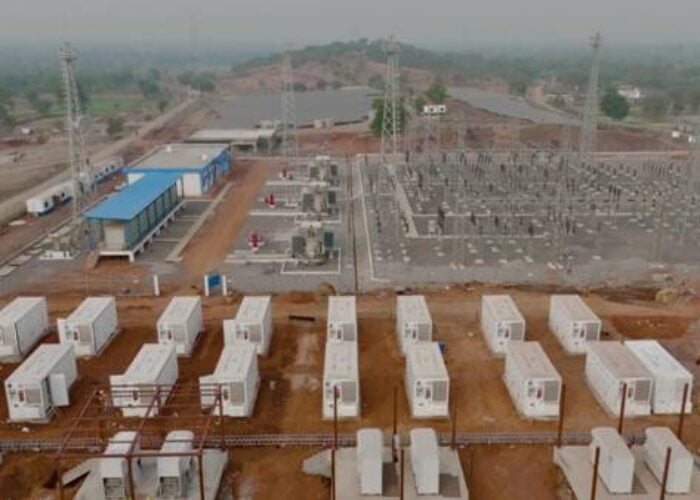
Australia’s National Electricity Market (NEM) hit a record high for the combined utility-scale solar PV and wind share in the electricity mix on 30 August.
Geoff Eldridge, NEM and energy transition observer at consultancy Global Power Energy, said on LinkedIn that the maximum utility-scale solar and wind share reached 47.2% at 07:50 on Saturday – a 1.4% increase on the previous record set on 6 September 2024.
Try Premium for just $1
- Full premium access for the first month at only $1
- Converts to an annual rate after 30 days unless cancelled
- Cancel anytime during the trial period
Premium Benefits
- Expert industry analysis and interviews
- Digital access to PV Tech Power journal
- Exclusive event discounts
Or get the full Premium subscription right away
Or continue reading this article for free
The NEM is the wholesale electricity market and power system serving eastern and southern Australia, connecting Queensland, New South Wales (including the Australian Capital Territory), Victoria, South Australia and the island of Tasmania.
“The combined wind and utility solar share approaching 50% highlights how much of the grid can be supported by weather-dependent generation in the morning hours,” Eldridge commented.
“With spring conditions ahead, it’s likely we’ll see further records tested – particularly as rooftop PV joins strong wind output in pushing system flexibility to new limits.”
Indeed, with Australia now transitioning out of its winter months and into spring, it is likely to follow the seasonal “solar duck curve”. This often sees combined utility-scale and rooftop solar PV generation hit its lowest point in June before rising to its highest seasonal point in December – the peak of the Australian summer.
You can follow solar PV generation trends in the NEM via our monthly NEM data spotlight series, available to Premium subscribers. Our recent article, covering generation in July 2025, saw utility-scale and rooftop solar PV generate a combined total of 2,135GWh.
Rooftop solar PV sets new record in Queensland
Alongside the records set by the Australian state’s utility-scale generation power plants, distributed rooftop solar PV also set new records for generation output over the weekend.
Indeed, rooftop solar PV generation records were successively set on 30 August and on 31 August.
On Saturday, the maximum share of rooftop solar PV reached 54.7% at 12:40. This represents an increase of 1.1% from the previous record of 53.6% set at 12:35 on 17 August 2025.
There was also a record set for maximum rooftop PV output, standing at 4,607.4MW at 12:00 on Saturday, which, according to Eldridge, is 3.3MW higher than the previous record of 4,604.1MW set at 12:30 on 25 October 2024.
But, less than 24 hours later, rooftop solar PV smashed its maximum share record by 1.6%, rising to 56.4% at 11:20 on 31 August 2025.
Unwelcome records set for curtailment in Queensland
Alongside these significant records for solar PV and the broader renewable energy generation industry in Queensland, the weekend also saw unwelcome records set for energy curtailment.
On 30 August, a new maximum curtailment record of 3,423.5MW was established at 10:35. This reflects a significant increase of 768.0MW, or 28.9%, from the previous record of 2,655.5MW, which was set at 13:00 on 29 August 2025.
At 10:35 on 30 August 2025, the curtailment share reached a new record of 42.7%, reflecting an increase of 10% from the previous value of 32.7% recorded at 10:05 on 6 October 2024.
Meanwhile, solar curtailment hit a new record of 2,601.9MW at 11:00 on the same day, an increase of 139MW, or 5.6%, from the previous record of 2,462.9MW, which was set at 10:40 on 6 October 2024.
Wind curtailment also secured a new curtailment record, rising to 1,018.0MW at 10:30 on 30 August – an increase of 264.4MW, or 35.1%, from the 753.6MW record at 15:20 on 10 July 2025.


