While there is no shortage of leading indicators in the PV industry that can be used to predict future trends in manufacturing and across the various companies involved in this space, one of the most pertinent ones relates to capital expenditure (or capex).
This article takes a close look at the output from new analysis undertaken by the in-house research team at PV-Tech’s parent company Solar Media Ltd., where we build up the profile of PV capex by analysing solar-specific upstream capex across more than 100 of the leading PV manufacturers across the polysilicon to module value-chain, supplemented by a bottom-up geographic segmentation over the main countries dominating PV capex in the next few years.
Try Premium for just $1
- Full premium access for the first month at only $1
- Converts to an annual rate after 30 days unless cancelled
- Cancel anytime during the trial period
Premium Benefits
- Expert industry analysis and interviews
- Digital access to PV Tech Power journal
- Exclusive event discounts
Or get the full Premium subscription right away
Or continue reading this article for free
Many other indicators are used today to judge the strength of PV manufacturers, including gross margins, geographic market share of module shipments, and so on. Some observers apply academic-type metrics applied to the solar industry, or bespoke tier groupings that are highly subjective. Often these methods fail to predict companies sustaining operations, particularly when it comes to manufacturing in China, or countries where this are other factors behind local manufacturing efforts.
Other industries, most notably the semiconductor industry, elevate the priority of R&D spending (often as a percentage of revenues) as one of the most critical metrics determining future competitiveness, or indeed the role of capital equipment suppliers’ R&D inputs.
However, we consider capex for solar manufacturers as being a much more critical metric to each of these above-noted alternatives today, for a number of reasons.
Capex in itself is a leading indicator of cash available or the ability to raise funds for future expansions or upgrades. Capex also is a sign of both existing fab utilization rates (new capacity is not generally needed for example if existing utilization rates are low) and the appetite to undertake upgrades for increased productivity. Finally, capex provides an indication of the company’s confidence to grow market-share or expand operations in new regions.
While not the full story by any means, capex also allow us to see the companies, regions and technologies being prioritized for production lines 12-18 months out. No other metric provides this in the solar industry, aside from the random announcements from equipment suppliers.
The following text and graphics in this blog focus on our bottom-up segmentation of PV capex across the value-chain, and the split across the main countries and regions where PV manufacturing is expected to occur over the time period 2017 to 2018. Historic segmentation is shown also that allows us to see the trends today and going forward.
The analysis is taken from the January 2017 release of our PV Manufacturing & Technology Quarterly report. The themes covered in the text form many of the topics to be discussed at the forthcoming PV CellTech 2017 event in Penang, Malaysia, 14-15 March 2017.
PV capex across the value-chain
We segment capex out across polysilicon, ingot, wafer, cell, module and thin-film segments. For polysilicon, we pro-rate company capex by looking at production output going to the semiconductor and solar industries to leave us with a polysilicon-for-solar capex estimate. In the case of new polysilicon factories build exclusively for solar industry supply, full capex levels are allocated to solar capex.
While cautious of some of the thin-film capex in China today that at face-value looks remarkably similar to lumpy one-off research contract business, we do nonetheless include this in the analysis for now. The challenge here of course is phasing the revenue profiles, with the Hanergy case-study weighing firmly on our minds, and assessing whether the capex spend is having any direct correlation with production output.
The split of PV capex by value-chain segment is shown below.
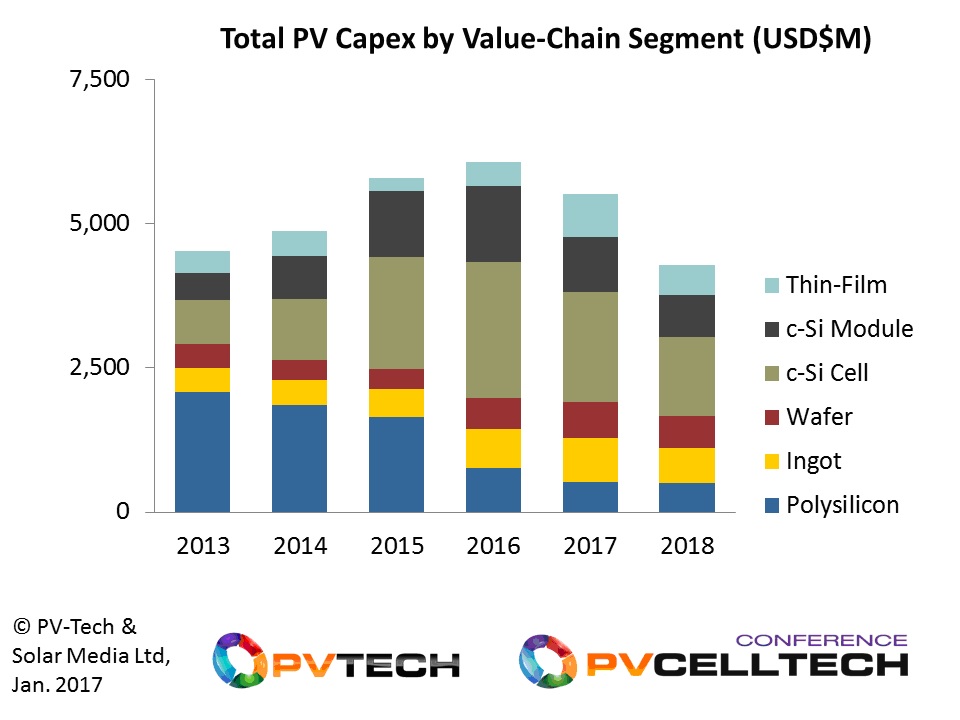
There remain a few key points to take from the graphic.
The most visible change over the 2015 to 2018 period comes from polysilicon, reflecting the end of the last major new plant capex having been completed by Wacker in Tennessee during 2016.
Also, and critically, the industry managed to sustain polysilicon (for solar) production levels above 70GW during 2016, despite the fact that for several months during Q3’16, overall utilization rates were reduced significantly.
Despite the fact that there are several sites where ground-breaking has commenced for new polysilicon plants, we retain our forecast for 2017 and 2018 as comprising of primarily maintenance and debottlenecking spend. As such, there is only upside to the polysilicon portion of the overall PV capex during this time period should any of the plans for new plants come to fruition.
The next segment worth elaborating on more is coming from thin-film. As touched on above, there is a nominal (albeit lumpy but incredibly valuable to the tool suppliers chosen) revenue contribution during both 2017 and 2018, coming almost exclusively from China. However, the forecast period shown here is dominated by First Solar, with capex allocations coming from the planned transition from Series 4 to Series 6 technology.
Finally, it is interesting to note that wafer and cell capex is being forecast to remain relatively healthy during 2017. This is coming from the new capacity being added outside China, in addition to further diamond wire saw and PERC upgrades. This supports the recent order uptick from Meyer Burger, for example, with the company having key products for each of these technologies.
We are forecasting this segment to decline in 2018, but there are of course many factors that could cause this to change in the next 12-18 months, especially if p-multi goes through a major upgrade phase either for PERC or coupled with the use of diamond wire saws for multi wafering.
Capex allocations across the main countries for 2017 and 2018
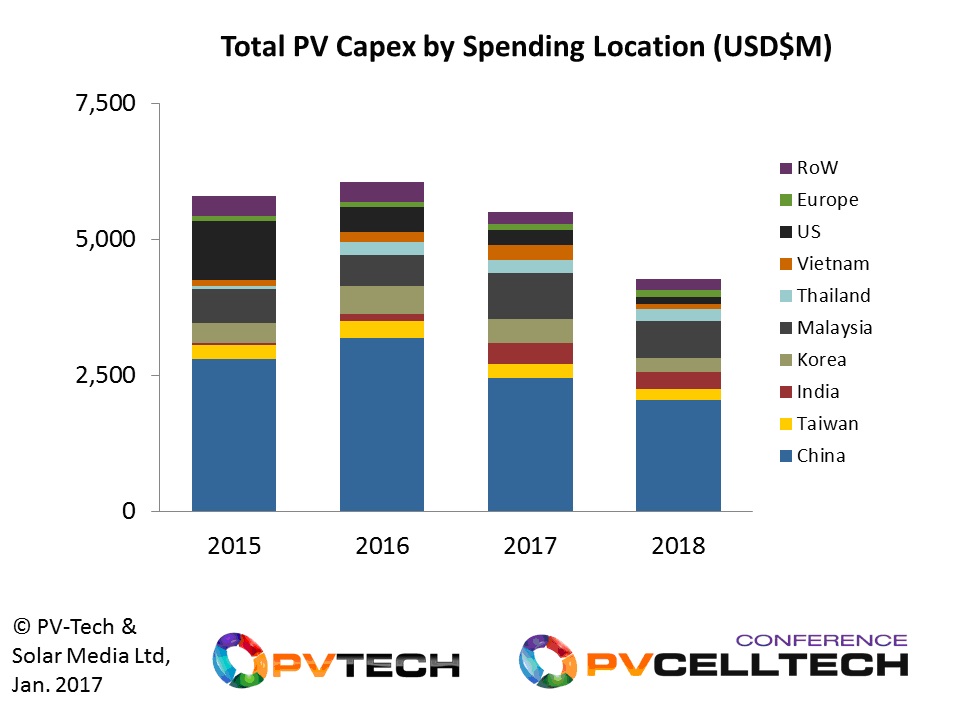
While the above value-chain segmentation provides some illuminating trend statistics, the breakdown by geography is even more useful.
While the historic period of 2015 and 2016 is helpful to understand, and 2017 is highly valuable, we consider the geographic analysis for 2018 to be perhaps the most critical glimpse into the near term manufacturing shift within the industry.
In doing a comparison with the our analysis last week on PV-Tech for capex specific to the c-Si cell stage, the above graphic covering the entire PV value-chain would appear to show sustained spending levels within China. The reason for this is simple: the dominance of polysilicon, ingot and wafer capacity and production, with the contributions purely from maintenance adding up strongly, even before we factor in upgrades, debottlenecking or new capacity.
In broad terms, we have about half of the global PV capex coming from China in 2018, with the rest from a range of different countries and regions. Therefore, it is the changes in the non-China part that are better leading indicators of how PV manufacturing is changing in the next couple of years.
Here we can see a grouping that is emerging across Asia that includes Malaysia, Thailand, Vietnam and India. Perhaps, we can even segment this further by removing Malaysia as the mature country from this list, leaving Thailand, Vietnam and India as the new countries making product for the PV industry, compared to 5 years ago.
In fact, all things considered, we end up with nine key countries (taking Europe as a country here) for PV manufacturing in 2018, with minimal contributions from the rest of the world (RoW) group. Interestingly, Japan barely features anymore in our analysis, with its contributions being merely one of small additions to the RoW entry.
PV CellTech agenda chosen to reflect manufacturing regions
In looking at the current agenda for the PV CellTech 2017 event in Penang, Malaysia, 14-15 March 2017, the choice of speakers and companies now becomes clear, with CTOs and heads of R&D from, for example, India (including Adani Group and Indosolar), Vietnam (including Boviet Solar), Thailand (including Trina Solar and Talesun) and Malaysia (including a range of companies including JA Solar, SunPower, JinkoSolar, and LERRI Solar). These companies are supplemented by China, Taiwan, Korea, Europe and the US, to ensure relevant contributions across the nine key manufacturing locations.
To view the latest PV CellTech agenda, please follow this link. To register for the event, click here.


