Having recently revealed that ‘Silicon Module Super League’ (SMSL) member JinkoSolar had become the largest solar PV module manufacturer in 2016, PV Tech gets to grips with the key factors behind the success.
Leapfrogging both Canadian Solar (ranked 2nd) and Trina Solar (ranked 1st) was not on the cards for JinkoSolar at the beginning of the year. Trina Solar had been the market leader for the last two consecutive years and was seemingly executing well and that stance was well communicated by the company to continue in 2016.
Try Premium for just $1
- Full premium access for the first month at only $1
- Converts to an annual rate after 30 days unless cancelled
- Cancel anytime during the trial period
Premium Benefits
- Expert industry analysis and interviews
- Digital access to PV Tech Power journal
- Exclusive event discounts
Or get the full Premium subscription right away
Or continue reading this article for free
Initial module shipment guidance at the beginning of the year from the six-strong SMSL members indicated that it was highly likely to be a two horse race between Trina Solar and JinkoSolar.
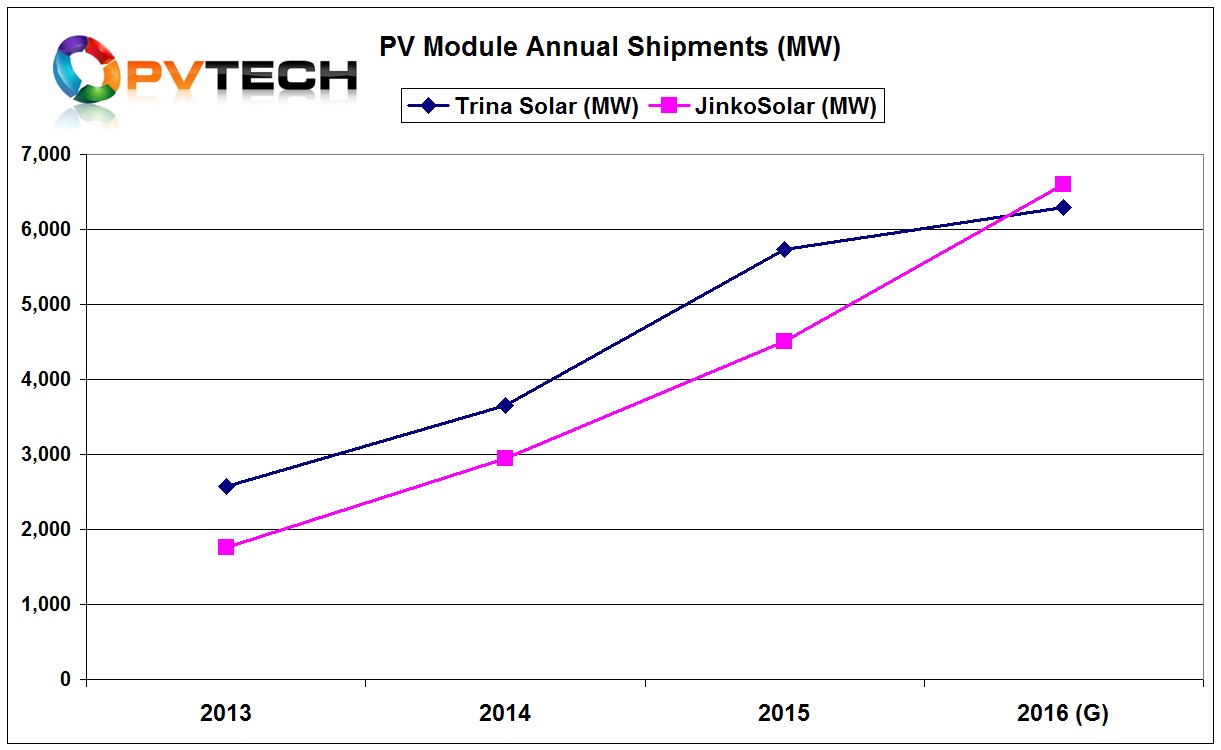
Trina Solar had guided total global shipments to be in a range of 6.3GW to 6.55GW, while JinkoSolar had guided ahead of Canadian Solar at 6GW to 6.5GW. Essentially, the guidance figures indicated a very close battle but with Trina Solar being a strong incumbent, JinkoSolar was definitely going to surpass Canadian Solar but most likely not Trina Solar in 2016.
Part of the rational for this was the lead that Trina Solar had over JinkoSolar in previous years as well as the fact that the shipment lead was extended in 2015 as can bee seen in the chart below.
However, the only doubt over Trina Solar retaining its lead was that looking at shipments on a quarterly basis, notably the fourth quarter of 2015.
JinkoSolar’s shipments were only slightly behind those of Trina Solar and these shipment figures were records for both companies and the industry as a whole.
However, the chart also shows that JinkoSolar’s shipment momentum was in full swing, while Trina Solar’s shipment momentum was slowing.
But taking quarterly shipment data as a key trend indicator is rather dangerous so it wasn’t until JinkoSolar has shown its shipments had surpassed Trina Solar’s in the first half of the year that we highlighted the leadership change.
As can be seen in the chart below, total quarterly shipments by Trina Solar have proved to be more erratic than those of JinkoSolar through the first three quarters of 2016.
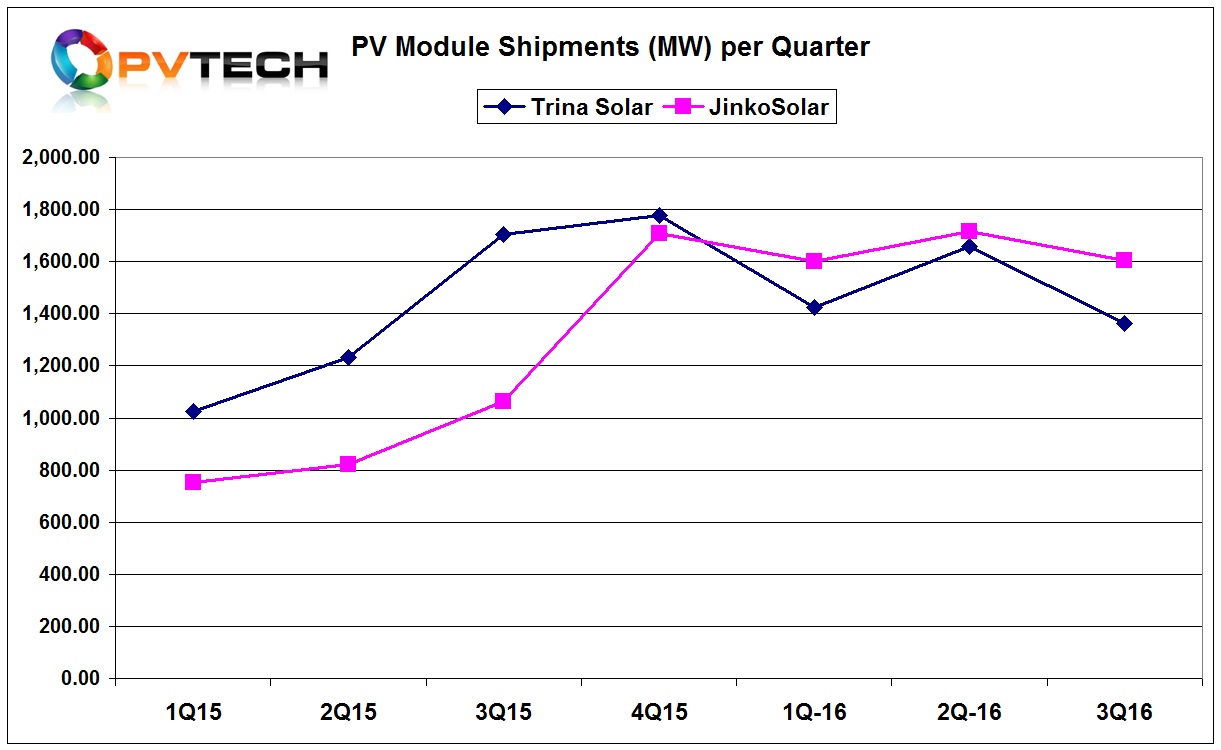
JinkoSolar has kept shipments hovering above 1.6GW all year, while Trina Solar’s have fluctuated at different levels each quarter. The chart also highlights that Trina Solar has lost some of its late 2015 momentum with no quarter coming close to third quarter or fourth quarter of 2015 shipment levels.
This is in contrast to JinkoSolar, which has just beaten the fourth quarter 2015 peak in the second quarter of 2016, while the two other quarters remained significantly higher than the other three quarters of 2015.
What the quarterly shipments chart doesn’t show but imbedded in the first chart is that in releasing third quarter results, JinkoSolar revised upwards its shipment forecast for the year to a tight range of 6.6GW to 6.7GW and fourth quarter shipments in the range of 1.7GW to 1.8GW.
In contrast, Trina Solar was silent on fourth quarter 2016 shipment guidance and did not revise its full-year guidance. However, due to the steep Q3 fall that was not guided, Trina Solar has a 1.8GW shipment mountain to climb to come close to meeting the low-end of full-year guidance.
Shipment fluctuation
As we have already highlighted quarter to quarter shipment figures can vary quite significantly, yet such volatility difference between the two leading companies in 2016 is harder to explain, especially when both companies have some of the largest global market footprints and module manufacturing capacity levels almost identical.
Therefore the volatility in Trina Solar’s quarterly shipments has been its downfall.
To understand both the volatility and identify where the lower shipments come from we looked at the quarterly regional shipment differences between Trina Solar and JinkoSolar.
As both companies have long been shipping modules to Europe and more recently both under the EU MIP pricing agreement until both have exited the agreement, it was surprising to see in the chart below that Trina Solar has been outpacing JinkoSolar all year, despite the reverse in the fourth quarter of 2015.
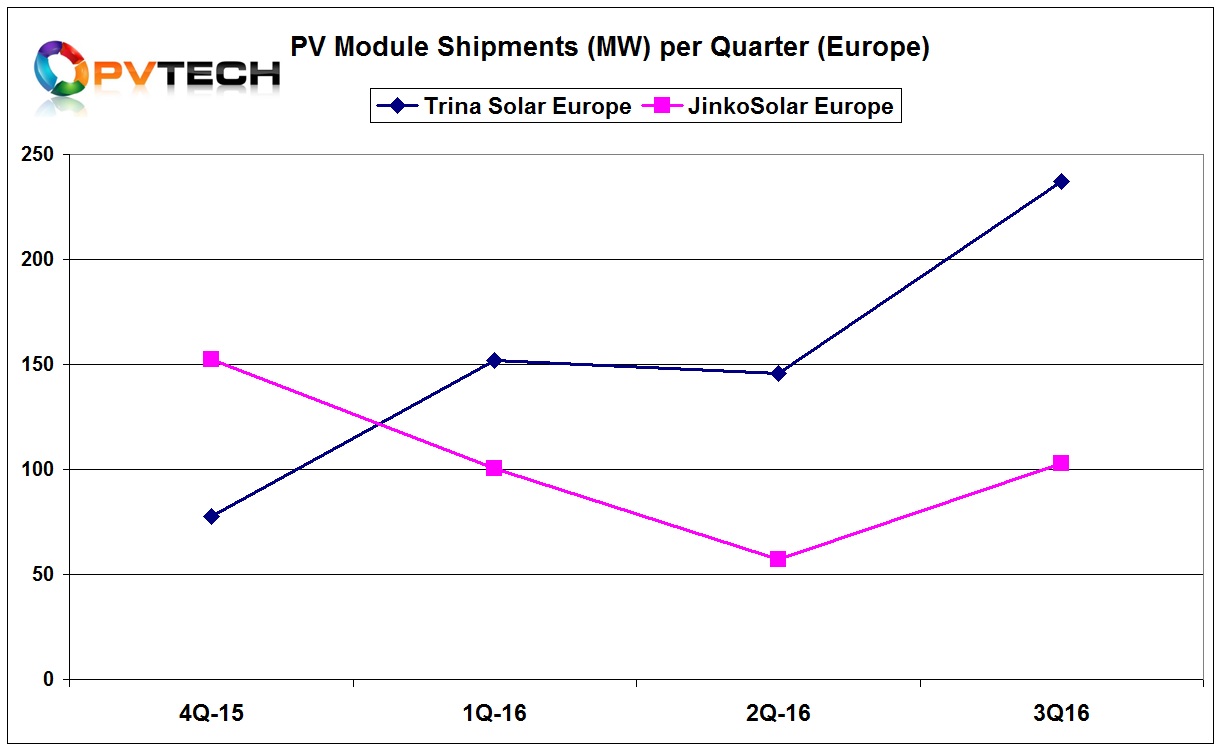
The shipment trajectory has clearly been in Trina Solar’s favour and shipment growth widening in the third quarter. Indeed, Trina Solar’s third quarter shipments were hailed as a record for the company in its earnings press release.
A factor in Trina Solar’s European success in 2016, could be down to its early withdraw from the EU minimum import price agreement that was announced in early December, 2015 and ratified in February, 2016. The company also acquired bankrupt Dutch cell producer, Solland Solar.
In contrast, JinkoSolar officially announced that it was withdrawing from the EU minimum import price agreement only in September, 2016.
However, the relatively stable European market is not reflecting the overall shipment trends of the two rivals in 2016.
With China remaining the largest market and both companies being Chinese the chart below may highlight closer to home dynamics at play between the two rivals.
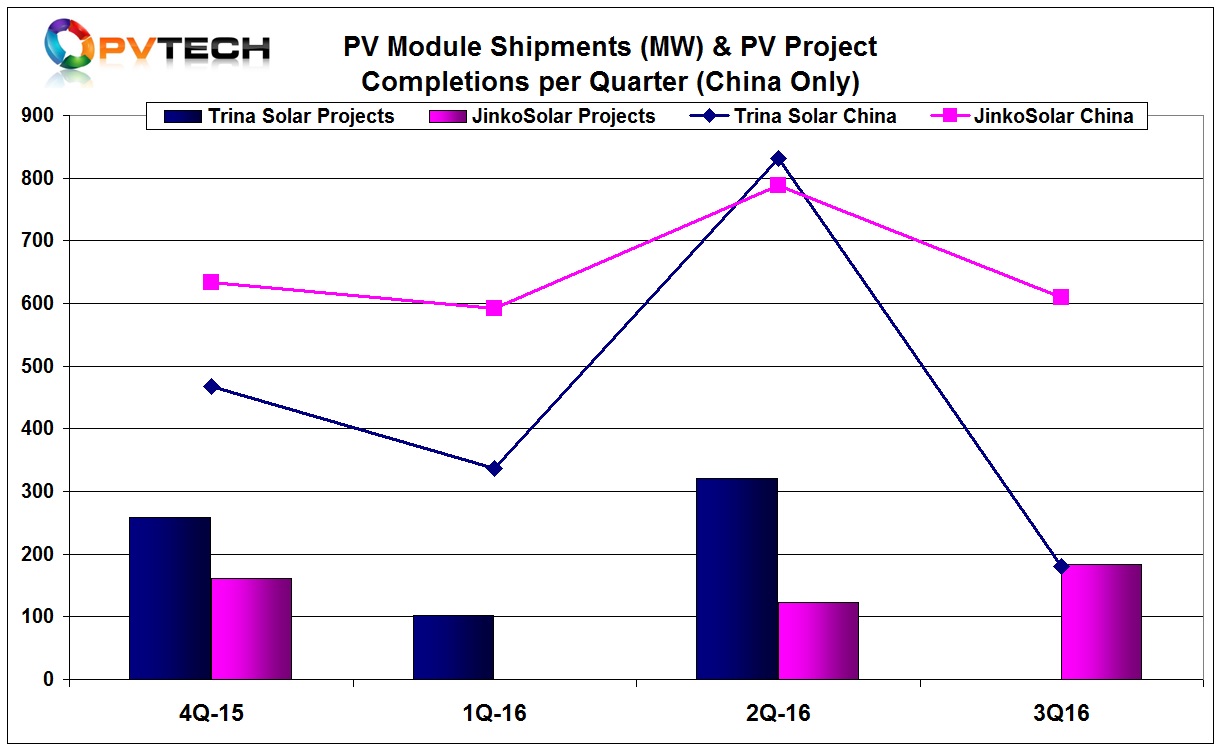
The chart above includes quarterly module shipments in China but as both companies have downstream project businesses that can also consume company modules we have included completed projects per quarter for each company.
As can be seen, the China market would seem to echo the overall quarterly shipment volatility experienced by Trina Solar in 2016, while mirroring the more steady state shipment levels of JinkoSolar.
Interesting is that both companies have had different quarters when no projects were completed but the volatility in shipments of Trina Solar and project completions has a much closer correlation, compared to project completions and shipments by JinkoSolar.
The next China specific chart below removes project completions and only includes external shipments within China from both companies.
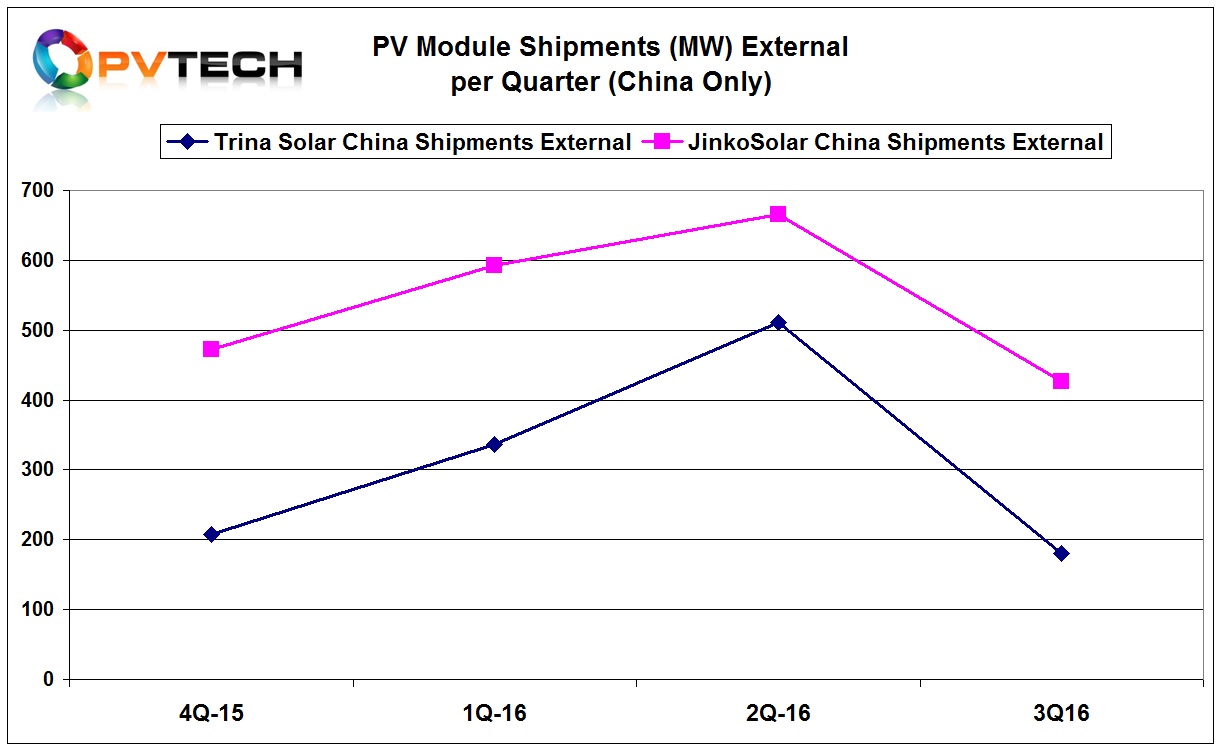
As can be seen, external shipment figures show that JinkoSolar has been consistently ahead of Trina Solar but that both shipment levels have closely mirrored each other and do not show any deviation except the now well now peak in module demand in the second quarter and the rapid demand decline in the third quarter.
However, the China external shipment chart does highlight on a regional basis that JinkoSolar clearly has had stronger domestic shipments than Trina Solar in 2016 and maintained a much higher quarterly shipment rate that has not changed throughout the year, despite the sporadic influence of larger downstream project business of Trina Solar in China.
Indeed, in reporting first quarter 2016 financial results, Trina Solar revised down its project completions guidance for the year from 750MW to 850MW to between 400MW and 500MW, citing FiT payments delays in China, and the high curtailment rate of solar power projects in Western China, which continued to cause problems. The company also highlighted module ASP declines in China at the end of the second quarter.
Another key global market is the US and both companies had highlighted at the beginning of the year that the US would be major markets for their modules.
Trina Solar, which had led shipments to the US in 2015, expected to ship between 1.7GW to 2GW to the US in 2016, while JinkoSolar had guided over 1.5GW but did not give a range.
As the US shipments chart below shows, there is a major disconnect between actual shipments from these rivals and expectations.
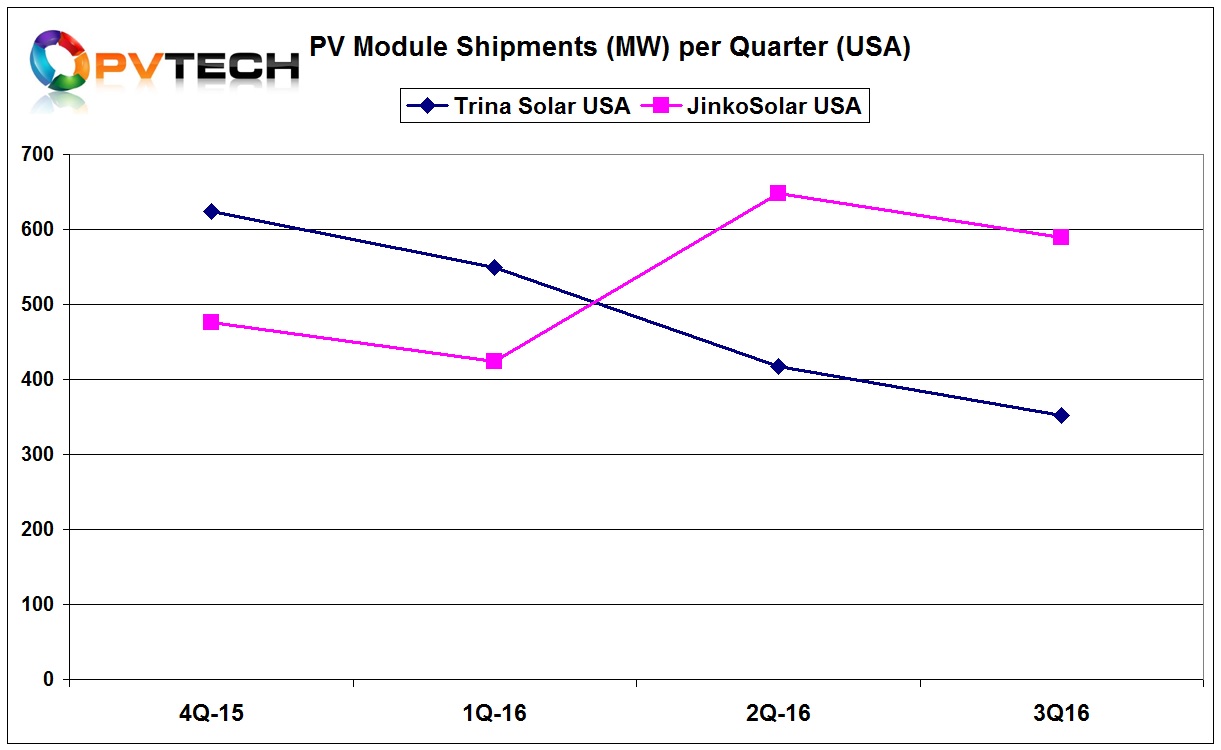
Clearly, Trina Solar’s shipments to the US have declined throughout 2016, quarter-on-quarter, while JinkoSolar’s surged significantly in Q2 and declined slightly less rate than Trina Solar’s in the third quarter.
JinkoSolar’s US shipments through the first nine months of 2016 have already exceeded its target and have reached over 1.6GW, while Trina Solar’s shipments in the same period have reached just over 1.3GW and are may not reach the low-end of previous guidance.
So the US is another market that JinkoSolar has led its rival in 2016, the challenge is why?
Trina Solar mentioned the 24.1% US shipment drop in the second quarter earnings call, but didn’t provide any reason for the decline and financial analysts didn’t pick-up on it.
Having not conducted a third quarter earnings call due to its planned exit from the NYSE stock exchange, the only commentary on its US shipments decline in the third quarter was in contrast with reality.
In its financial press release, Jifan Gao, Chairman and CEO of Trina Solar said: “Despite the headwinds, we were pleased that we were able to maintain our leading position in the U.S. Only by scanning Trina Solar’s third quarter presentation material was there reference to year-on-year rather than quarter-on-quarter US shipments and that US ‘leadership’ was actually based on cumulative sales and an acknowledgement of being ranked second in 2016 for module shipments.
Due to US anti-dumping duties a key circumvention for Chinese module producers has been to establish solar cell and module assembly production outside China.
JinkoSolar got the head start on Trina Solar in this respect, initially announcing a production plant in Malaysia that would have a solar cell capacity of 500MW and 450MW of PV module capacity in March, 2015. However, the facility would be operational in May 2015.
In contrast, Trina Solar’s first manufacturing facility outside China was initially announced in May 2015 with 700MW of nameplate solar cell capacity using its ‘Honey’ multicrystalline PERC solar cell technology and 500MW of PV module capacity in Thailand. The facility officially opened almost a year later in March, 2016.
Therefore, JinkoSolar had the opportunity to ship modules to the US without duties, lowering prices as a result and reduce its upfront cash costs when shipping modules made in China with duties paid in advance that was in contrast to Trina Solar.
With both companies touting global market footprints, the chart below combines all other niche markets under ROW (Rest of World), primarily due to the fact that official geographical shipment figures from both companies varies considerably outside the countries/regions already covered on a like for like basis.
Differences are evident, such as Trina Solar’s reference to Japan and ROA (Rest of Asia), which includes India, while JinkoSolar references APAC and ‘Emerging Markets’ that includes Latin America, Mexico and parts of MENA.
As the ROW chart below shows, both companies do indeed have significant shipments outside some of the largest markets with JinkoSolar shipments edging Trina Solar in a downward direction until the end of Q2.
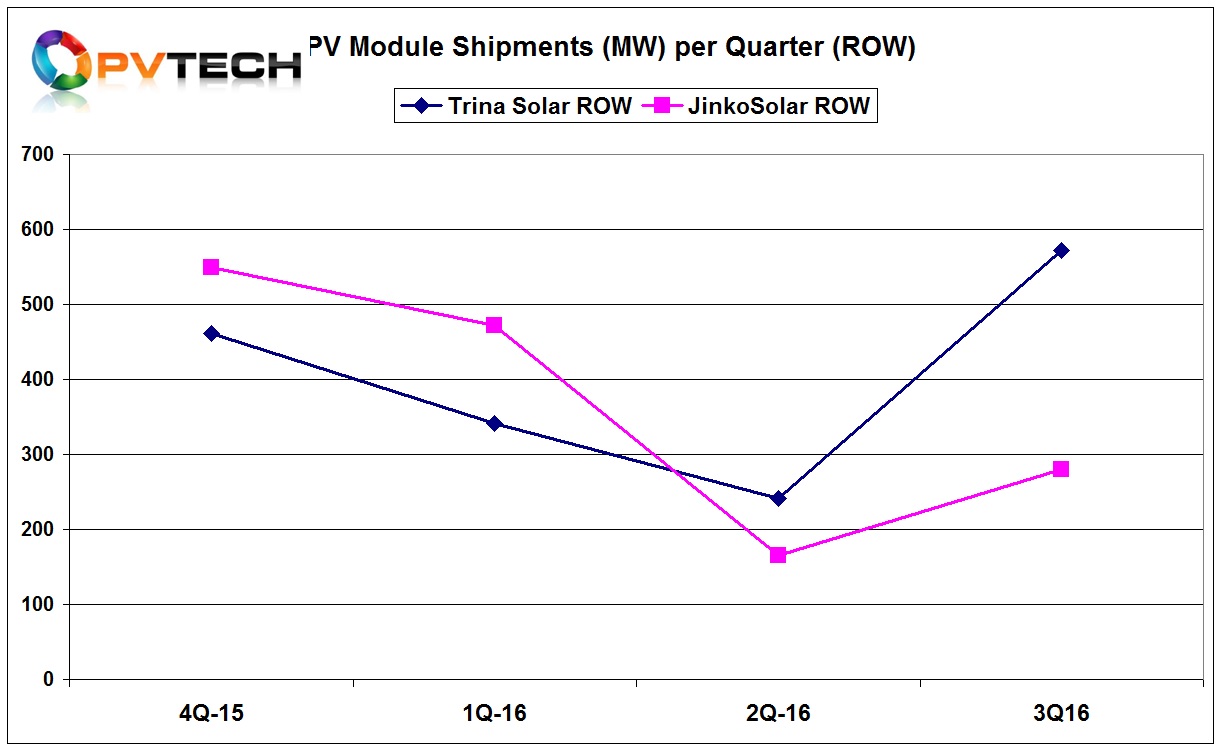
However, in contrast, Trina Solar has marched strongly ahead of JinkoSolar in ROW in the third quarter of 2016.
Taking all four quarters shown in the ROW chart, Trina Solar has shipped a cumulative 1,618MW, while JinkoSolar has shipped 1,467MW, giving the edge to Trina Solar.
Two key markets, China and the US look to have given JinkoSolar the volume shipments edge over Trina Solar in 2016, while support was also given in the first half of the year to JinkoSolar in the ROW sector.
However, Trina Solar would seem to have given key ground away to JinkoSolar in China and the US, while it has reversed its fortunes in Europe and ROW, notably the rapidly growing Indian market in the third quarter of 2016.
In 2017, both companies could once again take the leadership position as their does not seem to be another SMSL with the growth momentum or global footprint of these two manufacturers.
The other factor that has always been present but simply difficult to put a shipment figure on it is the positive impact on orders a company can achieve when in the market leadership position.
The bankability and kudos factors have often be perceived to have helped boost sales. In February, 2016 Trina Solar was named as the most 'bankable' PV module manufacturer globally by Bloomberg New Energy Finance (BNEF). Though this seems a little late for Trina Solar in 2016, we hope you get the idea.
Regrettably, we may not be able to track Trina Solar’s fourth quarter shipments or shipments to this level in the near-term due to its planned privatisation.
Though JinkoSolar’s first ever market leadership position has been secured in 2016, Trina Solar is also showing that a global footprint matters and sets the scene for another close leadership battle in 2017.
You may also be interested in attending our webinar to learn what to expect from the Silicon Module Super League in 2017.
WEBINAR: Benchmarking the leading solar cell and thin-film manufacturing technologies for 2017


