The PV industry is on track for strong growth in 2020, despite 10 months of the year being shrouded in uncertainty and perennial pessimism. And while almost all in the sector have been lamenting supposed softness in demand this year, attributed to the COVID-19 pandemic, it turns out that the limiting factor to production and shipment volumes this year simply comes down to the supply of raw materials, namely polysilicon.
This article summarizes what has been happening during 2020, and where the final numbers are likely to converge to. It discusses how the top-10 module suppliers have moved from 50% market-supply back in 2013 to 70% in 2020, shipping in excess of 100 GW of modules this year.
Unlock unlimited access for 12 whole months of distinctive global analysis
Photovoltaics International is now included.
- Regular insight and analysis of the industry’s biggest developments
- In-depth interviews with the industry’s leading figures
- Unlimited digital access to the PV Tech Power journal catalogue
- Unlimited digital access to the Photovoltaics International journal catalogue
- Access to more than 1,000 technical papers
- Discounts on Solar Media’s portfolio of events, in-person and virtual
Finally, I will highlight some of the other topics that will form the basis of a webinar I will deliver on PV-Tech this week, on 12 November 2020, alongside a talk from RETC. Please follow the link here, to register to listen in to these talks online.
Polysilicon limited but g/W declines act to ease capacity constraints
If nothing else significant had happened in 2020, the main takeaway for the PV industry would likely have been the fact that during mid-year, outages at several polysilicon plants in China had prevented the industry from seeing massive year-on-year growth, to levels easily in excess of 150GW and likely well above 160GW.
Often bad news gets the press, and this is what happened in 2020 for the sector owing to COVID-19 issues. Understandably, back in March/April, there was a huge fear that the PV industry could contract to the 100-GW-level. But within a couple of months, it was evident this was definitely not going to happen.
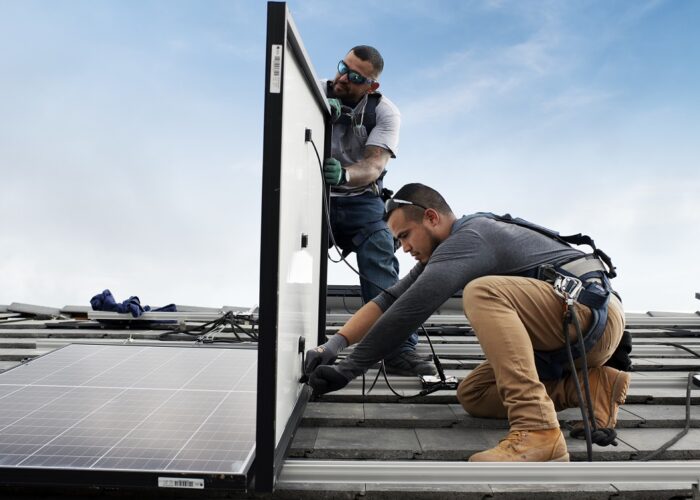
The segment most affected from COVID in 2020 has been the rooftop market, in particular residential. However, this part of the market is so small now, and of limited significance in terms of the real growth coming from utility solar. And then there is India, a country that was always likely to be affected once any lockdown or travel restrictions were imposed, more so than others.
Otherwise, 2020 is a utility-growth year, where the final quantity of shipped modules is limited purely by polysilicon availability. It is not just that large parts of plant capacity were removed mid-year; many poly companies retreated from the industry between 2018 and the start of 2020. In previous years, they may have filled the gap created this year, but once a polysilicon plant is idled, there is no way of any quick restart. The reality of all these shuttered plants is that they were barely economical when poly was trading at 20$/kg, far less lows of 6-10$/kg in recent quarters.
The one upside to polysilicon shortage in 2020 comes from further strong declines in blended g/W levels, coming mainly from more shift from multi-to-mono and p-mono PERC efficiency gains. Other factors are helping, including kerf loss, a few microns shaved off wafer thicknesses, and improvements in cell-to-module interconnection losses.
Each year, the industry needs less polysilicon for every GW of module capacity shipped. This year, for the first time, these small changes are all adding up to keep the sector in a strong positive annual growth trajectory.
It is polysilicon supply to solar – coupled with expected thin-film shipment volumes in 2020 – that are driving current forecasting to the range 140-GW level. The only question mark will be how much polysilicon is finally made in the last quarter of the year. There is probably a 5% error bar on the 140 GW number right now, more so on the downside than upside.
Production through the value-chain
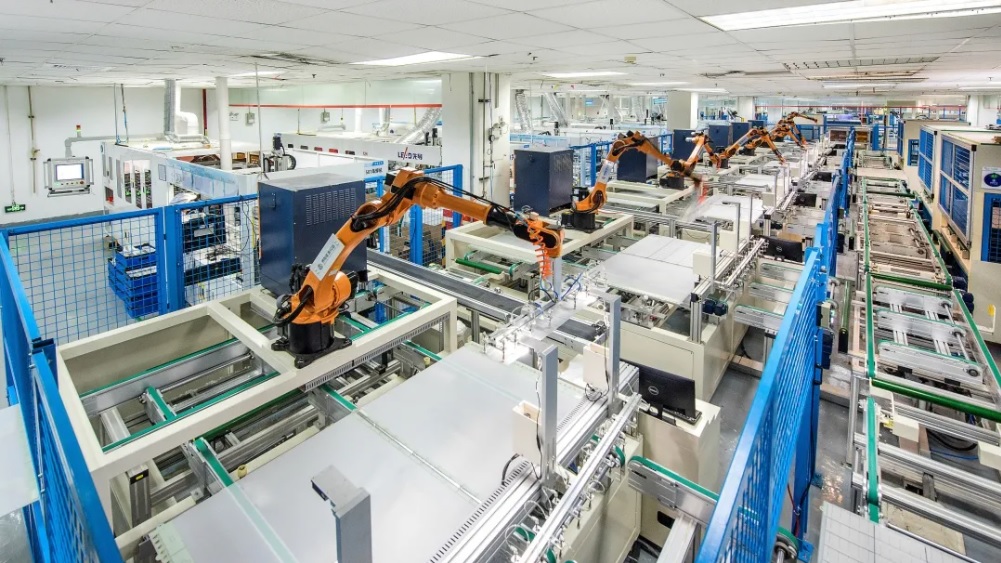
Shortage of capacity for pulling ingots, casting bricks (if required) or slicing wafers was simply not an issue in 2020. Collectively, LONGi and Zhonghuan could have almost supplied the entire sector with mono wafers, had this been the modus operandi governed by a 100-120 GW year picture.
Cell capacity has been more about wafer dimension compatibility, than nameplate or effective capacity levels. And in 2020, the industry in China has been consumed with changing wafer sizes and trying to convince the world how they need to absorb the changes as nothing but beneficial.
For most of the major module suppliers, many have fully interchangeable monofacial/bifacial capability. The driver here was the fact that it is better to make 100% of cells bifacial, than have a mixture of technologies running concurrently.
In 2020, ingot/wafer and cell/module production has largely followed the availability of polysilicon at any given time, and this will continue into 2021 until – as is the way – too much polysilicon capacity becomes available and pricing collapses again for poly suppliers. Despite the polysilicon outages this year, and the number of players exiting the industry in the past 2-3 years, the industry is on a path to drive g/W down to the point where double-digit growth can be sustained purely by optimizing polysilicon plants each year. This time is not here yet, and this explains why there are years left still to announcing and building 50-100,000 MT sites in China.
Understanding supply and demand
Every year is a lesson in how supply and demand are different things, when looking at the PV industry. Only, in 2020, the lesson is somewhat more pronounced and subtle in nature.
For those, sizing markets adding up what they think end-market ‘demand’ is from about 100 countries globally, it is another year of underestimating and sorting out your numbers in the first half of 2021, and then even some.
Another massive problem this year with this demand-led approach (i.e. kind of ignoring what is actually being produced and the modules that are shipping) is that any reliance with grid-connection figures released at the country-specific level are leading people down a garden path. The US and China markets are consuming modules in 2020 way above any demand numbers coming out. There is always a delta; this year it is huge.
Following the leading module suppliers
If there were three module suppliers only to the whole industry, the only way to track the market size would be to follow the supply channels of these three companies. Nobody would even look at government or trade-body guesses each quarter or year.
This bottom-up production/shipment methodology is still the gold-standard from an analyst perspective. The only problem is that there are about 100 module suppliers that need to be looked at, and about 80% are experts in secrecy and facts-evasion. It just makes the production and module supply tracking route very hard, but still way better than waiting to add up incorrect government figures 3-6 months after the event.
Here is another reference point. If you look at the percentage of modules shipped from the top-10 suppliers in any given year, you can do a back-of-envelope calculation that actually turns out to be very good!
Back in 2013, the top-10 module suppliers shipped 51% of modules that year (to end-customers, not OEM based). This percentage level grew marginally through to 2018, where it was 61%. Even in 2019, there was marginal growth – to 63%. In 2020, there is a jump more than before, to around the 70% level. However in 2020, the top-10 module suppliers are on track to ship 100-105 GW.
Similarly, one can track top-5, or top-20. All roads lead to a 140 GW production and supply market in 2020. Sadly for the leading players that had increased shipment levels by 30% or so, they are not quite grabbing the market-share gains they were thinking, had they believed the figures being branded by several today of 2020 being a much smaller market.
Impact on PV ModuleTech Bankability Ratings
One of the biggest question marks during the year – in addition to production and supply numbers – has been on module supplier profitability or parent entity solvency. Which companies have module operations that are shielded from any short-term losses? How are the pure-play module suppliers performing, especially those from the top-10 grouping behind the 100-GW-plus supply this year? Is everyone going through a market-cap bonanza right now?
The Q4’20 PV ModuleTech Bankability Ratings hierarchy pyramid is going to be released during my talk on the webinar on 12 November. This will show the module suppliers that have benefited from 2020 industry events, and those that have not done so well. Is LONGi Solar still the only AAA-Rated module supplier? Have any module suppliers moved into the exclusive A/B Grade bands this quarter? Which module suppliers are on the ‘up’?
To attend the webinar on 12 November 2020, featuring two talks (one from myself on module dynamics in 2020 and bankability rankings; and the other from Cherif Kadir on the hail durability testing (HDT) process, from RETC), please use the registration page here.

