In the solar industry, ground-based solar radiation measurements are often treated as the ‘ground truth’, the ultimate reference point for resource assessment and performance monitoring. However, a measurement is only as reliable as the instrument providing it and the maintenance protocol supporting it.
Without rigorous quality control (QC), even expensive, high-precision radiometers can generate misleading data. At last year’s PV Performance Modeling Collaborative (PVPMC) event in Cyprus, Solargis researchers presented a new study quantifying how much error can be introduced when quality control is neglected. The findings reveal that retaining flawed measurements can introduce significant bias into downstream PV applications, turning a project’s greatest asset into a hidden liability.
Try Premium for just $1
- Full premium access for the first month at only $1
- Converts to an annual rate after 30 days unless cancelled
- Cancel anytime during the trial period
Premium Benefits
- Expert industry analysis and interviews
- Digital access to PV Tech Power journal
- Exclusive event discounts
Or get the full Premium subscription right away
Or continue reading this article for free
The ubiquity of measurement errors
The Solargis team analysed 154 one-year datasets of Global Horizontal Irradiance (GHI) to assess the prevalence of data quality issues, and the results were sobering: on average, 15% of GHI measurement data is affected by quality issues.
While some issues are sporadic, others are persistent. The most common anomalies identified included:
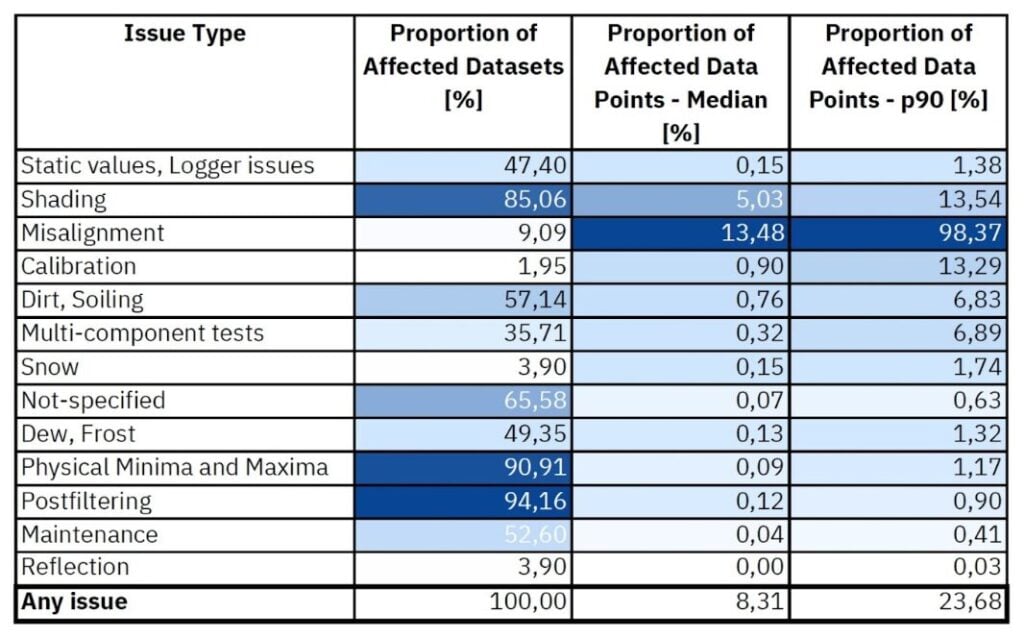
- Exceeding physical limits, which was found in 91% of datasets.
- Shading, which affected 85% of datasets, often due to nearby obstacles or measuring infrastructure.
- Soiling, which was identified in 57% of datasets.
- Dew and frost, which affecting nearly half (49%) of all datasets.
The percentage of datasets affected by these factors is shown, in full, in the table below.
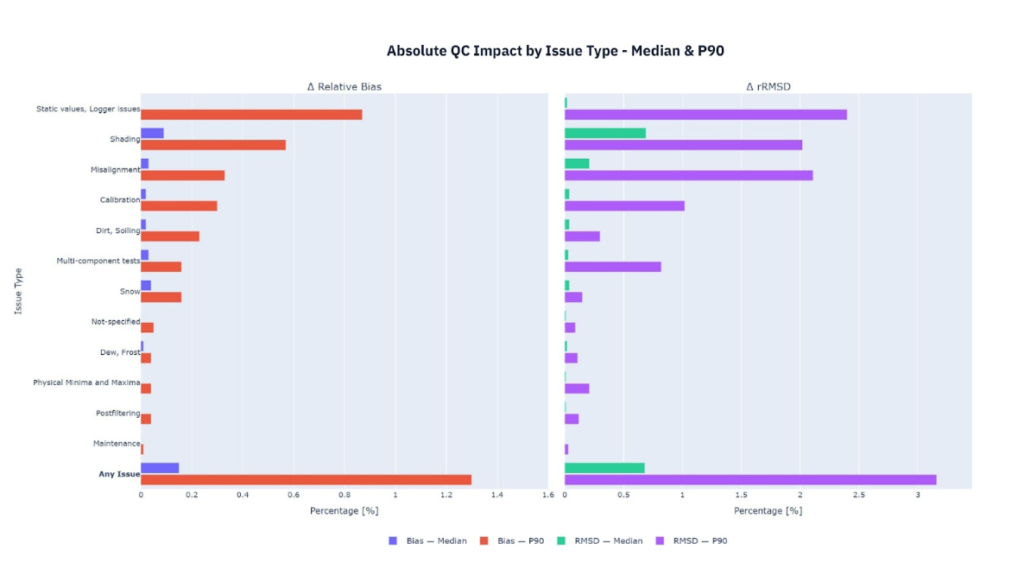
When these issues are left unflagged and uncorrected, they directly impact the uncertainty of the data. The Solargis study found that neglecting QC increases the bias of the dataset by up to 1.3% (at the 90th percentile), with Root Mean Square Deviation (RMSD) increasing by up to 3.2%. In extreme cases within our sample, the bias reached as high as 50.7%.
This is particularly significant at present due to variations in GHI results. Figures from Solargis show that, in 2025, solar irradiance in industry leader China was up to 20% higher than the historical average.
The variability of soiling
It can be tempting to correct certain errors like soiling with a standard “factor” after the campaign is finished. However, the Solargis case study on 108 GHI datasets suggests this practice should be avoided.
The team has found no consistent correlation between the occurrence of soiling and the resulting magnitude of bias, as shown in the graphs below.
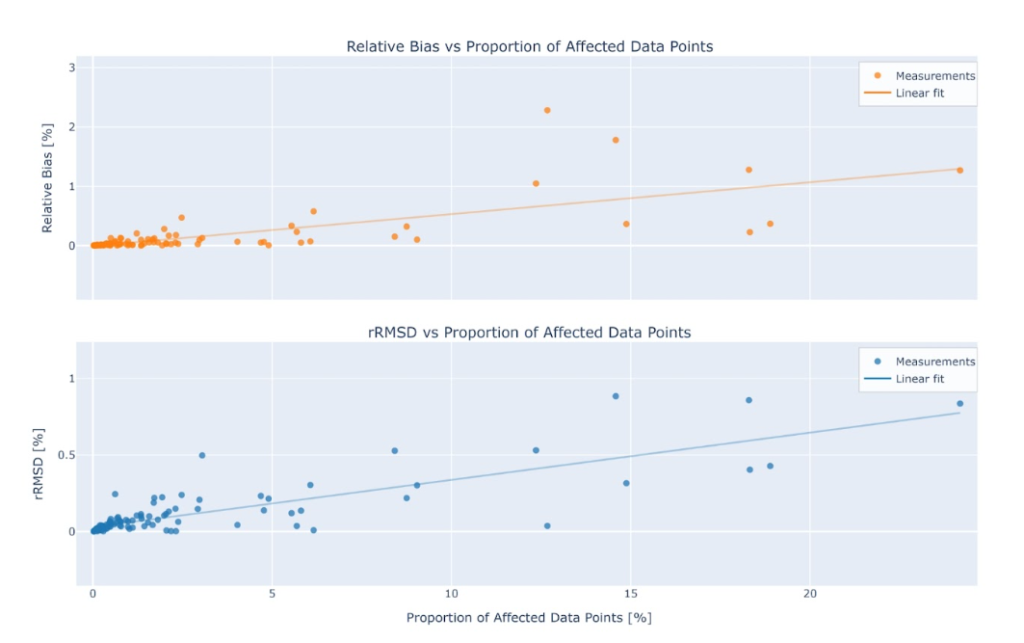
Soiling is highly variable; it can have an impact at any part of the day, and its severity ranges from minor signal reductions to severe drops in measured irradiance. Counter-intuitively, in some specific conditions, soiling can even artificially increase the measured irradiance signal due to scattering effects.
This variability means that we cannot simply derive a general uncertainty factor for dirt. Instead, soiling requires event-specific professional assessment to avoid oversimplifying and miscalculating the solar resource.
Sensor misalignment
One of the most preventable, yet damaging, issues is sensor misalignment. Unlike random noise, a tilted sensor introduces a systematic error that persists throughout the entire campaign. In a simulation of GHI measurements across five geographic locations, the Solargis team introduced controlled misalignments ranging from 0.2 degrees to 10 degrees.
The results showed that the error introduced by a tilted sensor is not uniform; it increases with latitude, meaning the further a site is from the Equator, the more severe the impact of tilt becomes.
Even a minor tilt can materially affect the results. At higher latitudes, a misalignment of just 1 degree can introduce a bias of up to 1.6% in absolute value. This highlights why precise installation is critical. If a sensor is slightly tilted at a project site in Northern Europe or Canada, the resulting data skew will be far more severe than the same tilt at a site in Central Africa.
Proactive versus reactive quality control
The traditional approach to measurement campaigns often treats QC as a final step—something to be done after the data is collected. This ‘reactive’ approach is risky. By the time errors like calibration drift or misalignment are detected, months of data may already be compromised. The in-house Solargis research concludes that regular, proactive QC is far more effective.
By monitoring data streams continuously, operators can detect anomalies early, such as a dirty dome or a shifted mounting, and deploy maintenance teams immediately. The difference between a bankable dataset and a flawed one is rarely just the hardware; it is the rigour of the maintenance.
Early detection and mitigation of measurement issues are the only ways to significantly reduce uncertainty and prevent data loss.


