With the United States on the cusp of an IRA-driven surge in utility-scale PV deployment, Mark Bolinger and Joachim Seel of the Lawrence Berkeley National Laboratory cover key technology and market trends in this synopsis of their annual “Utility-Scale Solar” report series.
Much has changed in the four years since our last market update in PV Tech Power, which covered utility-scale PV market trends in the United States through the end of 2018 (“Utility-Scale PV surges onward in the United States” in PV Tech Power, Volume 2022, February 2020). Cumulative deployment has increased by 150%, from 24.6GWac at the end of 2018 to 61.7GWac at the end of 2022. Adding battery storage to both new and existing PV plants to boost their market value has become common in parts of the country with relatively high solar market shares, like California and the Southwest. And the amount of solar capacity in interconnection queues across the US has increased by more than 660GWac (+235%).
Try Premium for just $1
- Full premium access for the first month at only $1
- Converts to an annual rate after 30 days unless cancelled
- Cancel anytime during the trial period
Premium Benefits
- Expert industry analysis and interviews
- Digital access to PV Tech Power journal
- Exclusive event discounts
Or get the full Premium subscription right away
Or continue reading this article for free
This impressive expansion of the utility-scale market over the past four years has occurred despite significant headwinds. The US solar market has weathered the same ‘perfect storm’ of a global pandemic, a war in Ukraine, supply chain disruptions and related project delays, high inflation, and rising interest rates that all other industries have faced.
In addition, US solar developers have had to deal with tariffs on imported solar cells and modules, as well as US Customs and Border Protection seizures of substantial shipments of imported modules under the Uyghur Forced Labor Prevention Act. Finally, though its impact is only starting to be felt, there has been a dramatic shift in federal policy over this period.
Four years ago, the solar industry was in the midst of a multi-year phaseout of its primary federal incentive, the Investment Tax Credit or ITC (indeed, another article in that same Volume 22 of PV Tech Power was titled “Life after the ITC”). Today, however, the industry is looking forward to a decade or more of policy certainty, with renewed and expanded incentives, under both the Bipartisan Infrastructure Law (BIL) passed in November 2021 and, more notably, the Inflation Reduction Act (IRA) passed in August 2022.
Against this backdrop of remarkable change, the rest of this article highlights select key trends from the latest edition of Berkeley Lab’s annual ‘Utility-Scale Solar’ report (available at utilityscalesolar.lbl.gov), which presents trends in deployment, technology, capital expenditures (CapEx), operating expenses (OpEx), capacity factors, the levelised cost of solar energy (LCOE), power purchase agreement (PPA) prices, and wholesale market value among the fleet of utility-scale photovoltaic (PV) and hybrid PV+battery plants built in the United States through the end of 2022. We define “utility-scale” to include any ground-mounted PV or PV+battery plant where the PV capacity is larger than 5MWac.
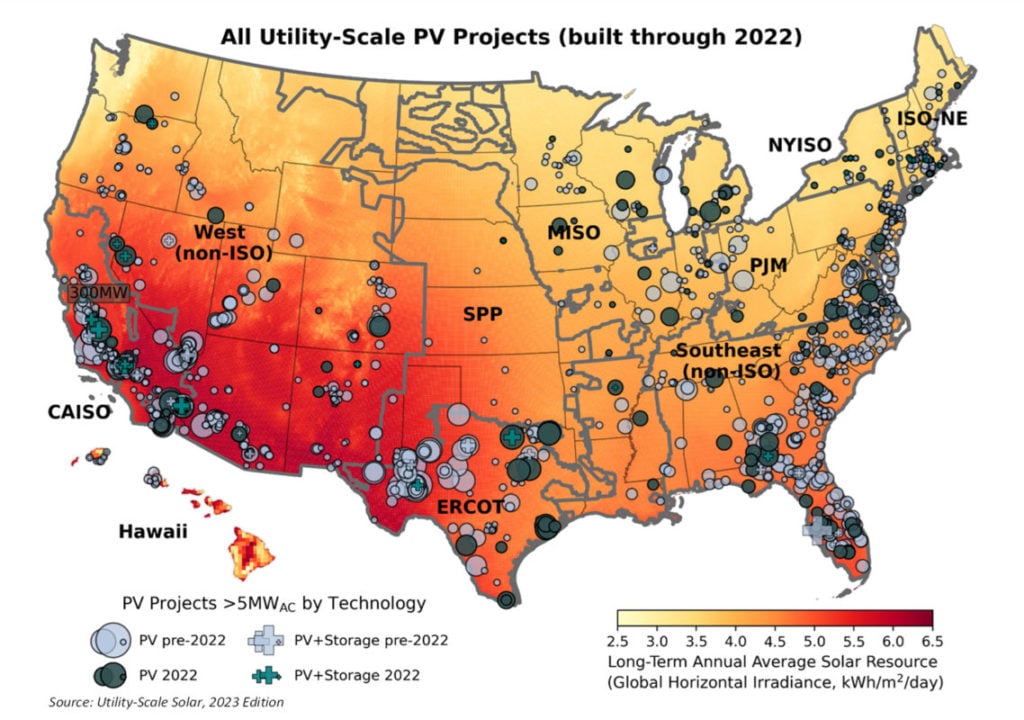
Last year (2022) was another strong year for utility-scale PV deployment in the United States. Though below 2021’s record buildout of 12.5GWac, 2022’s addition of 10.4GWac brought cumulative installed capacity to 61.7GWac across 46 states (Figures 1 and 2). Texas (2.5GWac) added the most new utility-scale PV capacity in 2022, followed by California (2.1GWac), Virginia (0.6GWac), and Georgia (0.5GWac).
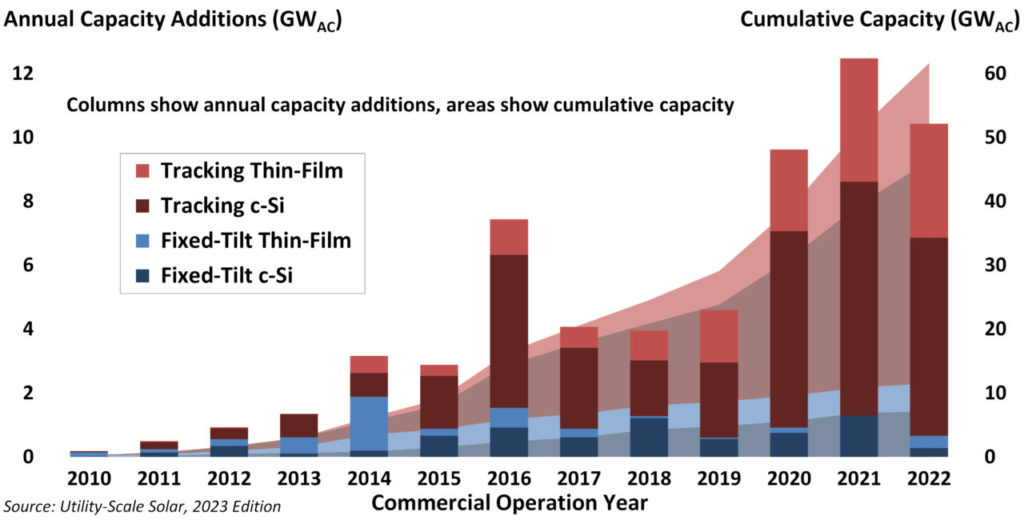
Post-2014, as its CapEx premium diminished (Figure 3), single-axis tracking became the dominant mount type, and has been deployed with 94% of all new utility-scale PV capacity added in 2022 and 81% of cumulative capacity (Figure 2). Although c-Si modules still account for the majority of utility-scale PV capacity in the US (62% of 2022 and 68% of cumulative capacity), their market share has declined over the past few years (Figure 2). Conversely, the only currently viable alternative to c-Si—i.e., thin-film cadmium telluride (CdTe) module technology from First Solar—has become more attractive over this period, in part because of its domestic manufacturing presence, which has enabled it to avoid tariffs and module impoundments at the border (and which will qualify First Solar modules for domestic content “bonus credits” under the IRA going forward). First Solar’s CdTe modules account for 38% of capacity additions in 2022, bringing its cumulative US market share to 32%.
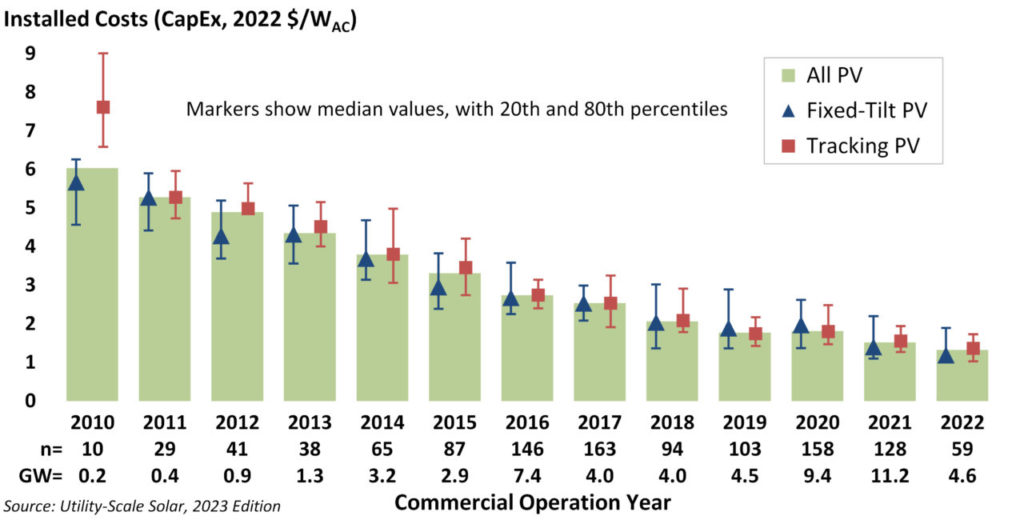
Despite general inflationary pressures over the last two years, installed costs (CapEx) among the sample of plants for which we have data—including 59 plants built in 2022, totalling 4.6GWac—continued to fall, though the year-over-year decline has been modest for the past four years. Median installed costs for the 2022 sample were U$1.3/Wac (or US$1.1/Wdc), and installed costs in general have fallen by 78% (averaging 10% annually) since 2010 (Figure 3). Post 2015, the incremental cost of tracking (over fixed-tilt) mounts has been barely discernible at the sample level.
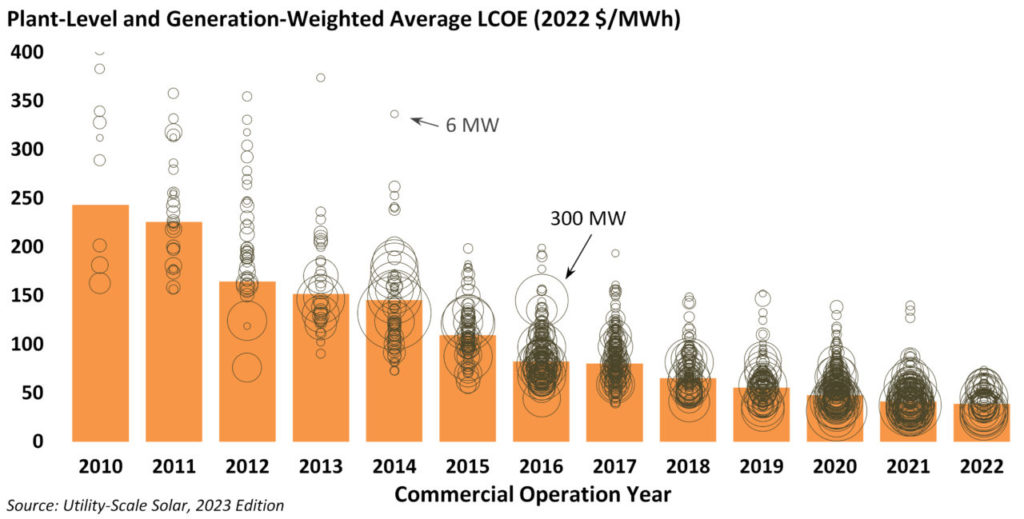
The decline in CapEx (Figure 3), in combination with generally improving capacity factors, lower operating expenses, and (until recently) record-low financing costs caused utility-scale PV’s LCOE to fall slightly to US$39/MWh on average in 2022 (Figure 4). The average LCOE has fallen by about 84% (averaging 14% annually) since 2010, though LCOE reductions over the past few years have been quite modest.
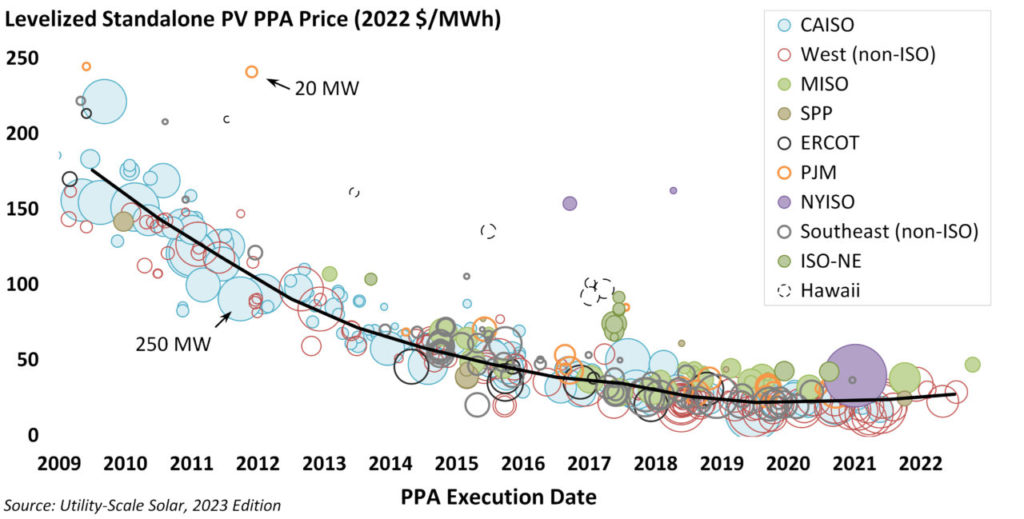
Of course, LCOE is somewhat of an analytical construct, and does not directly impact investment decisions on its own. For insight on what buyers are actually paying for solar generation, we can instead look to power purchase agreement (PPA) prices, which have largely followed the decline in solar’s LCOE over time, but since 2019 have stagnated and even increased slightly (Figure 5). Unlike LCOE, PPA prices generally reflect the receipt of federal tax credits—i.e., the investment tax credit (ITC) through 2022, but either the ITC or the production tax credit (PTC) starting in 2023, thanks to the IRA—and so are typically lower than corresponding LCOEs. PPA prices from a small sample of contracts signed in 2022 average US$25/MWh (levelised, in 2022 dollars), which represented relatively good value at the time, given elevated wholesale power prices resulting in part from the war in Ukraine.
Looking ahead, solar’s newfound access to the PTC in 2023 and beyond should help to relieve some of the upward pressure on PPA prices. A decade ago, when utility-scale PV’s CapEx was much higher (e.g., ~US$5/Wac per Figure 3) and capacity factors were lower, the ITC was a more lucrative tax credit for the industry. But particularly with CapEx at current levels (i.e., a median of US$1.3/ Wac, per Figure 3), many utility-scale PV plants would be better off choosing the PTC instead of the ITC—and, starting in 2023, that choice is now readily available under the IRA.
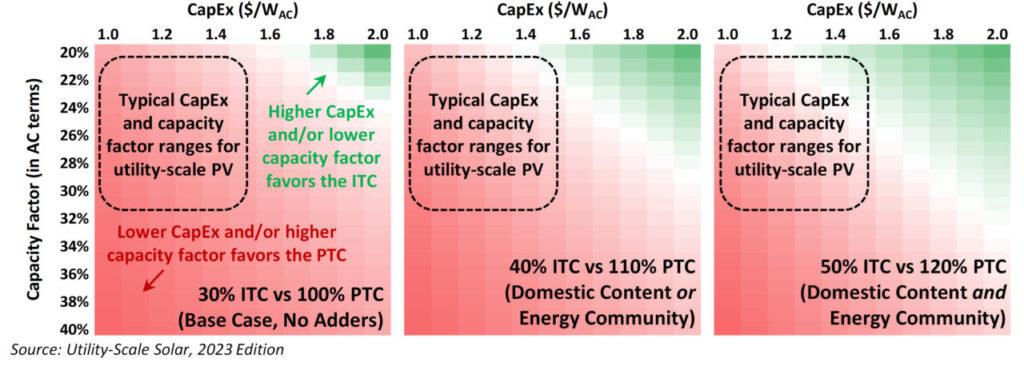
Figure 6 models the preference for either the ITC (shown in green) or PTC (in red) based solely on various combinations of CapEx and capacity factor.
Higher-cost, less-energetic plants may still favour the ITC, particularly if able to capture one or both tax credit adders by satisfying domestic content thresholds and/or locating the plant in a designated “energy community” (e.g., a community that has lost jobs in the fossil fuel industry). This is because the ITC’s “10 percentage point” adders for domestic content and energy communities are worth more than the PTC’s “10 percent” adders (e.g., moving from a 30% to a 40% ITC represents a 33% increase—rather than a 10% increase—in the value of the ITC). But given the typical CapEx and capacity factor of most utility-scale PV plants in the United States, we expect to see many plants opt for the PTC instead.
Of course, other factors besides CapEx and capacity factor also affect this choice, such as financing considerations related to the potential preferences of tax equity investors or tax credit buyers (under the IRA’s new transferability provisions) for one type of credit or the other.
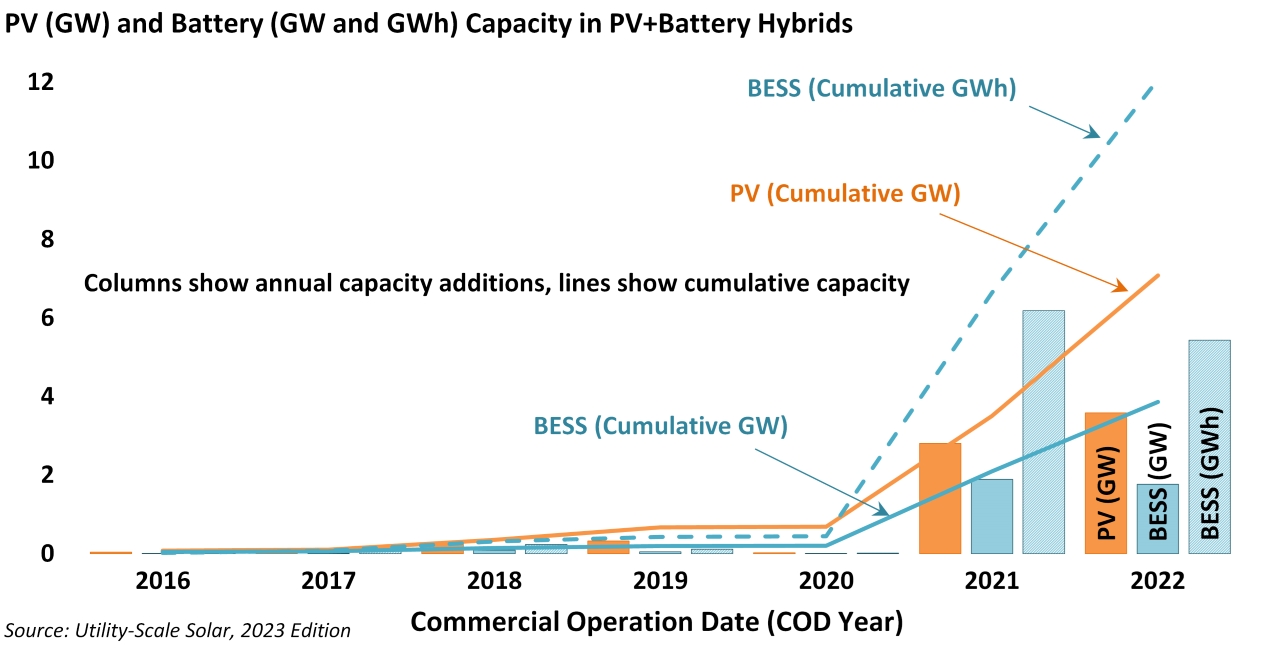
Hybrid PV+battery plants were still mostly just a concept in development pipelines back in 2018, but after two breakout years of deployment in 2021 and 2022, there were 7.1GWac of PV paired with 3.9GW/12.1 GWh of battery storage operating in the US at the end of 2022 (Figure 7). These PV+battery hybrid plants have become increasingly common in markets with a higher share of solar generation, as a way to increase solar’s market value by shifting a portion of excess (and low-value) mid-day solar generation into higher-value evening hours.
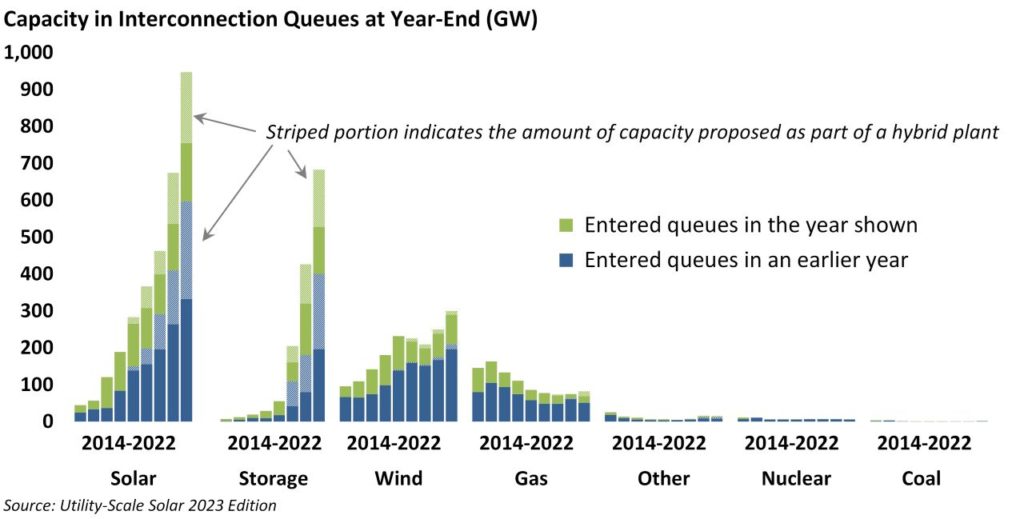
Despite the IRA’s extension of the ITC to standalone storage (meaning one no longer must pair storage with PV in order to qualify it for the ITC), this trend of pairing PV with batteries seems likely to continue. For example, year-to-date PV+battery hybrid plant deployment through October 2023 has already surpassed the capacity added in 2021 or 2022, and nearly half of all solar capacity in interconnection queues at the end of 2022 was paired with a battery (Figure 9). Notably, in November 2023, the US Internal Revenue Service clarified that hybrid PV+battery plants will be able to claim the ITC on the cost of the battery system while also claiming the PTC on the solar generation—a winning combination for PV plants sited in good solar resource areas.
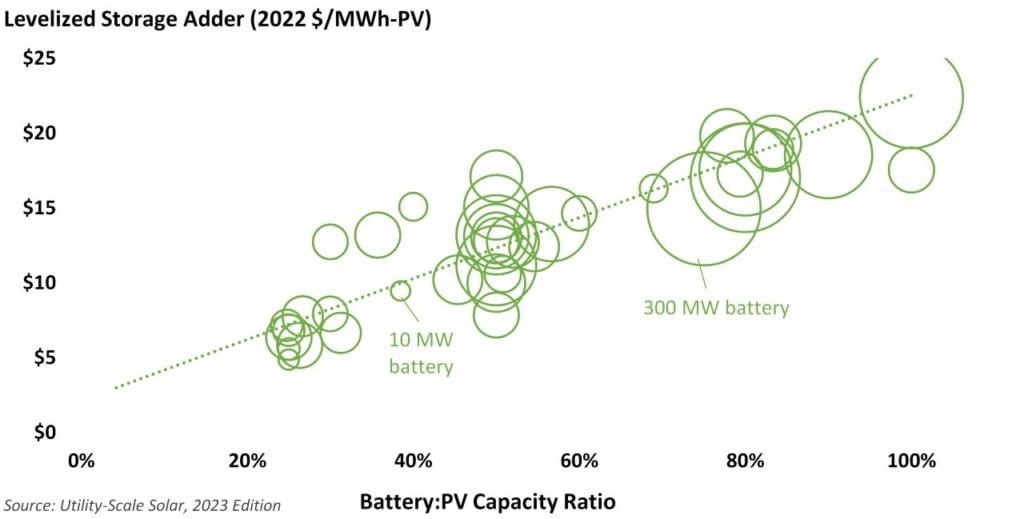
Of course, adding a battery to a standalone PV plant adds cost and, therefore, requires higher compensation. PPA price data from a sample of 40 PV+battery hybrid plants (totalling more than 5.6GWac of PV and nearly 3.2GW of four-hour batteries) that break out the pricing of the PV and battery components suggests that adding batteries has increased standalone PV PPA prices by anywhere from US$5/MWh-PV to US$25/ MWh-PV (levelised in 2022 dollars), depending on the amount of battery capacity relative to PV capacity (Figure 8).
Looking ahead, a massive pipeline of utility-scale PV and PV+battery plants dominates the interconnection queues across the country. At the end of 2022, at least 947GW of solar capacity was in the queues, and nearly 457GW (or 48%) of that total was paired with a battery (Figure 9). This, too, stands in stark contrast to back in 2018, when there were “only” 283GW of solar in the queues, and only 10% of it was paired with a battery. Though not all the capacity in the interconnection queues will ultimately be built (e.g., historically, only about 10% of solar capacity in the queues has achieved commercial operations), the queues are nevertheless a clear indication of strong interest in utility-scale solar (and storage). And with a decade of policy stability to look forward to under the IRA, sustained growth in the coming years seems likely.
While the IRA’s policy developments— perhaps most importantly for utility-scale PV, providing the option of a PTC for solar along with various bonus credits or tax credit adders (e.g., for locating projects in energy communities and/or for using domestically produced equipment) for either the ITC or PTC—have generated much excitement within the industry, we did not see the full impact of these incentives in the 2023 edition of our ‘Utility-Scale Solar’ report, for several reasons. First, the IRA was passed relatively late in 2022, with Treasury guidance on implementation coming even later, and the market naturally takes time to react.
In addition, several incentives only came into effect starting in 2023, while the latest edition of our ‘Utility-Scale Solar’ report focuses primarily on projects built in 2022 (or earlier). Meanwhile, interconnection queues from some of the bigger regions had either already closed their open application season by the time the IRA passed, or else discouraged or did not accept new interconnection requests in 2022.
Nonetheless, 2023 is shaping up to be the strongest year on record for utility-scale solar in the United States, driven in large part by early activity under the IRA. For example, the first ten months of 2023 have already yielded 10.6GWac of PV capacity additions, with at least several more gigawatts likely to come online by the end of the year. Moreover, as mentioned above, year-to-date PV+battery hybrid plant deployment in 2023 has already surpassed prior-year records. Particularly as some of the headwinds mentioned at the outset start to diminish, and the industry moves beyond the initial “waiting on IRA implementation guidance” period and upshifts into a higher gear, it seems likely that the utility-scale PV market in the US could very well soon start to “sound like a broken record” in terms of repeatedly breaking its own prior-year deployment records.
Acknowledgement
This material is based upon work supported by the US Department of Energy’s Office of Energy Efficiency and Renewable Energy (EERE) under Solar Energy Technologies Office (SETO) Agreement Number 38444 and Contract No. DE-AC02-05CH11231. The US Government retains, and the publisher, by accepting the article for publication, acknowledges, that the US Government retains a non-exclusive, paid-up, irrevocable, worldwide license to publish or reproduce the published form of this manuscript, or allow others to do so, for US Government purposes.
Authors
Mark Bolinger is a research scientist at Lawrence Berkeley National Laboratory, where his work focuses on understanding the cost, performance, and value of renewable generation and storage within electricity markets. Mark holds a masters degree in energy and resources from the University of California at Berkeley and a bachelors degree from Dartmouth College.
Joachim Seel is a policy researcher at the Lawrence Berkeley National Laboratory. His research focuses on solar and wind market developments, the integration of high shares of renewable generation into the electricity grid, and associated effects on electricity markets. Joachim holds a PhD and MS of energy and resources and a masters degree in public policy from the University of California at Berkeley.


