Solar manufacturing announcements in the United States have multiplied at a pace that makes them nearly impossible to track by headline alone. Since the current policy cycle began, hundreds of billions of dollars of announced investment has been spread across dozens of projects targeting the domestic supply chain. But as the previous articles in this series have shown, capacity announcements do not automatically translate into operating production lines, and the gaps that matter most, particularly at the wafer and cell stages, remain wide open despite the noise. The question this article asks is straightforward: how much of the announced capital is converting into real capacity, and how much remains speculative?
From announcements to capital: what the numbers actually show
PV Tech Research’s ‘US Domestic Solar Manufacturing Tracker’ currently records 55.90GW of credible cell manufacturing capacity under construction in the US, alongside 41.36GW of module capacity, 22.1GW of polysilicon and ingot capacity and just 13.3GW of wafer capacity, the same figures introduced in Part 1 of this series. What the tracker adds is visibility into the capital behind those numbers. At least US$3.2 billion in disclosed investment backs roughly 19GW of new module capacity, and at least US$5.8 billion backs around 21.46GW of new cell capacity. Both figures are almost certainly conservative. Not every announcement discloses an investment value, so the US$3.2 billion and US$5.8 billion figures capture only a fraction of the pipeline where a dollar amount was made public. The true capital commitment behind the full announced pipeline is very likely a multiple of what can currently be verified.
Try Premium for just $1
- Full premium access for the first month at only $1
- Converts to an annual rate after 30 days unless cancelled
- Cancel anytime during the trial period
Premium Benefits
- Expert industry analysis and interviews
- Digital access to PV Tech Power journal
- Exclusive event discounts
Or get the full Premium subscription right away
Or continue reading this article for free
Pipeline status: four stages, four realities
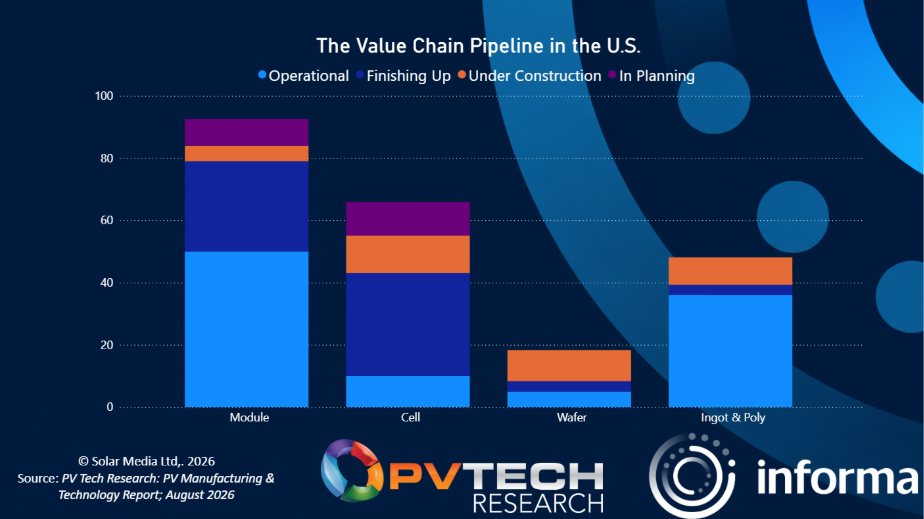
The reason headline gigawatt figures are a poor guide to the state of the market is that “announced” encompasses an enormous range of project maturity levels. PV Tech Research’s tracker breaks the pipeline into four stages, and the distribution across them tells a more precise story than any single aggregate number.
Stage 1 – Announced and Planning: Cell capacity totals 10.8GW and module capacity 8.6GW. These are the least certain figures in the pipeline. Projects at this stage are most exposed to cancellation, delay, or changes in scale or technology.
Stage 2 – Construction: The picture shifts upstream. Polysilicon leads with 8.8GW, alongside 12GW of cell capacity and 5 GW of module capacity. This is a meaningful signal in its own right. The polysilicon investment that looked comparatively thin against the scale of the gap in the second article is, in fact, further along in its execution than the headline capacity number alone would suggest.
Stage 3 – Finishing Up (build well underway): Cell capacity leads at 25.66GW, module capacity follows at 17.16GW. This is the most encouraging tier of the tracker, since it represents the capacity closest to becoming a shippable product. The focus on cells and modules, however, also highlights the persistent problem of insufficient wafer capacity to support this pipeline in the US.
Stage 4 – Operational: 36GW of polysilicon capacity producing 15.5GW, 5GW of wafer capacity producing 3.2GW, and cell and module capacity and production as detailed across the first two articles in this series. This is the only tier where the numbers are not projections.
Why project-level tracking beats headline counting
The case for tracking individual projects rather than adding announced gigawatts is straightforward once the four-stage breakdown is laid out: not all announcements are equally verifiable, and treating a 50%-complete project the same as an operational line overstates the real capacity available at any given moment. Knowing the stage a project has actually reached is what turns a raw announcement total into a usable market signal, because it separates capacity that is genuinely close to shipping from capacity that still depends on financing, permitting, or policy conditions holding steady.
That distinction is also what makes the wafer gap the clearest finding in this dataset. Across every stage of the tracker (Announced, Planning, Construction and Operational), wafer capacity is the smallest number on the page, and by a wide margin. The great majority of US manufacturers currently building capacity are concentrated in cells and modules, with only a minority committing capital to wafering. That leaves the question raised in the second article unresolved: without meaningfully more wafer capacity under construction, a domestically produced polysilicon ingot still has nowhere to go but overseas, where it is sliced into a wafer and shipped back into the country before it can become a US-made cell. Of everything the tracker shows, this is the gap most likely to still be open in 2030 unless investment patterns shift.
From capacity to compliance
Understanding where capacity sits across the four stages is essential, but it does not answer the more urgent question facing manufacturers, developers and investors: which of these facilities will produce cells that meet the overlapping requirements of Anti-Dumping and Countervailing Duty (AD/CVD) rules, Foreign Entity of Concern (FEOC) restrictions and potential Section 232 tariffs on solar imports?
The 55.90GW of cell capacity currently under construction represents real progress, but scale alone does not determine market access. A domestically located facility does not automatically produce compliant output if its cells rely on Chinese polysilicon or on wafers processed by entities subject to FEOC restrictions. And if Section 232 tariffs are imposed, the compliance balance shifts again: cells that currently qualify under AD/CVD rules may still face tariffs if their upstream inputs, wafers, polysilicon, or both, originate in countries subject to Section 232 measures.
This is where the wafer gap becomes a multi-layered compliance issue. If US-made cells depend on offshore wafers, their compliance status depends not only on the origin of those wafers and the polysilicon inside them, but also on whether that origin exposes them to tariffs that could erase their cost competitiveness. The more fragmented the domestic supply chain remains, the more exposure manufacturers and developers carry across multiple regulatory fronts.
Applying the framework to the pipeline
The next article in this series applies the four-tier cell procurement framework we have developed at PV Tech Research to the capacity tracked here, mapping announced and operational projects against AD/CVD, FEOC and Section 232 compliance requirements. It identifies which portions of the 55.90GW cell pipeline are likely to qualify as Tier 1 (fully compliant across all three regimes), which face compliance uncertainty, and which are structurally unlikely to meet the requirements that govern federal procurement and IRA incentive eligibility.
Learn more about the rapidly evolving US PV manufacturing supply chain at our PV CellTech USA in California on 13-14 October. Full details and booking are available here. Click here to read the other articles in this series.