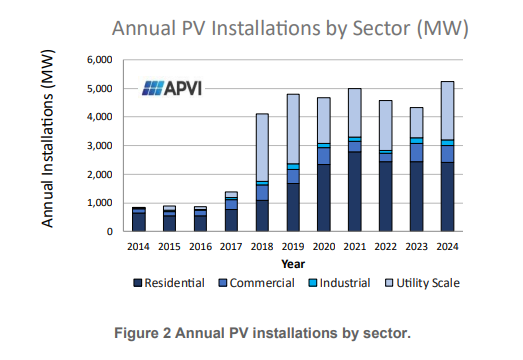
Australia achieved a record-breaking 5.3GW of solar PV installations in 2024, marking a recovery for the market while highlighting the nation’s unique position as a rooftop-dominated solar economy.
According to figures from the International Energy Agency (IEA), utility-scale solar additions reached 2GW in 2024, bringing volumes back toward peak levels seen in 2018-2019. Rooftop installations across residential and commercial and industrial (C&I) sectors remained stable at 3.2GW, maintaining the distributed generation focus that distinguishes Australia from most global markets.
Try Premium for just $1
- Full premium access for the first month at only $1
- Converts to an annual rate after 30 days unless cancelled
- Cancel anytime during the trial period
Premium Benefits
- Expert industry analysis and interviews
- Digital access to PV Tech Power journal
- Exclusive event discounts
Or get the full Premium subscription right away
Or continue reading this article for free
Despite recording its highest annual installation volume, Australia failed to rank among the world’s top ten markets for the second consecutive year, ending a streak that had persisted since the IEA’s Photovoltaic Power Systems Programme (PVPS) began tracking market dynamics in the 1990s.
This shift reflects the rapid expansion of solar markets in other regions, while Australia’s growth has stabilised.
Despite this, it is worth noting that Australia’s rooftop solar industry remains among the world leaders, with installations surpassing 27GW in the first half of 2025, as shown in the graph below.
Rooftop solar dominance drives market growth
The Australian solar landscape remains fundamentally different from international markets, with rooftop installations continuing to drive demand.
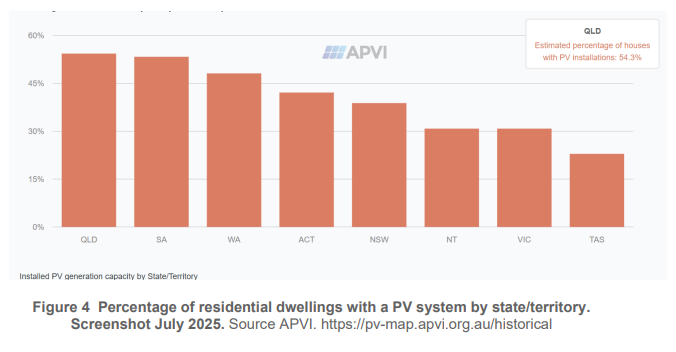
Over 40% of Australian free-standing homes now operate rooftop solar systems, supported by government incentives that provide upfront capital cost reductions running until 2030. Solar power currently supplies approximately 20% of the nation’s total electricity demand.
The residential sector’s strength reflects the success of the Small-scale Renewable Energy Scheme (SRES), which creates trading certificates that can be redeemed as upfront capital subsidies for systems up to 100kW.
This mechanism has enabled Australia to achieve a world-leading installation rate exceeding 1.52kW per capita, with total installations now exceeding four million systems nationwide.
Regional variations demonstrate the technology’s broad adoption, with Queensland and South Australia approaching 50% penetration rates for free-standing homes equipped with solar systems. Some localities within these states report rooftop solar densities exceeding 60%. Tasmania, with lower solar irradiation levels of 3.7kWh per year, exhibits a more modest adoption rate of 20% among free-standing homes; these trends are shown in the graph below.
The average residential installation size has grown to nearly 10kW in 2024, peaking above 10kW in December and representing an increase from less than 9kW in 2021-2022.
This growth prompted a revision of market categorisation, with residential systems now classified as 0-15kW, expanded from the previous 0-10kW threshold. C&I installations are now categorised as 15-100kW systems.
System pricing continued its downward trajectory, with typical residential installations priced at AU$1.20 (US$0.78) per watt excluding subsidies, which provide an additional 40 Australian cents per watt reduction depending on solar irradiation levels.
Module prices reached record lows, with typical crystalline silicon modules priced at AU$0.20 per watt in 2024, down from AU$0.30 per watt in 2023, reflecting global manufacturing overcapacity.
Utility-scale solar recovery and policy framework evolution
Large-scale solar installations above 5MW contributed 2GW to the annual total, representing a recovery from recent years and bringing the cumulative centralised solar capacity to 13.4GW.
The utility-scale sector benefits from Large-Scale Generation Certificates under the Renewable Energy Target, which provides annual revenue based on energy generation rather than upfront subsidies.
The Australian government’s Capacity Investment Scheme (CIS) aims to deliver 40GW of additional electricity-generating capacity by 2030, up from an initial 32GW target announced in July 2025.
The scheme targets 23-26GW of renewable energy generation capacity and 9-14GW of clean, dispatchable capacity, creating a pipeline for continued utility-scale solar development.
Policy challenges persist around connection approvals, congestion management and fragmented access arrangements, which increase costs and risks for grid-scale projects.
The Australian Energy Market Operator (AEMO) implements strict curtailment rules that limit large-scale solar output to protect system strength. Regular curtailment occurs in South Australia, where large-scale solar capacity stands at 1,100MW, alongside more than 1,800MW of wind capacity.
Battery storage deployment accelerated alongside solar installations, with 31,120 residential battery units registered in 2024, averaging around 7kWh capacity.
The cumulative total reached 124,425 residential battery systems, indicating growing integration between solar generation and energy storage technologies. The introduction of the Cheaper Home Batteries Program in 2025 is expected to drive significant battery adoption, complementing the recovery of solar installations.
Australia’s solar manufacturing sector, which began in the 1990s with companies such as Tideland, Solarex and BP Solar, experienced renewed interest in 2024. The federal government announced the AU$1 billion Solar Sunshot Program in March 2024 to support the commercialisation of Australian solar innovations and enhance local supply chains.
The first round of the Solar Sunshot programme concluded with prefabricated solar structure provider 5B becoming the first recipient. Other recipients included Tindo Solar, an Australian module manufacturer, Solquartz, Energus and Stellar PV. A second round of the programme was launched earlier this year.
Current domestic manufacturing capacity remains limited to approximately 100MW from Tindo Solar; however, the policy framework aims to rebuild local capabilities that were previously competitive before production shifted to Germany and subsequently to China.
Grid integration challenges and market outlook
The cumulative installed capacity reached 40GW at the end of 2024, comprising 26.1GW of distributed solar and 13.4GW of centralised installations, as shown in the graph below.
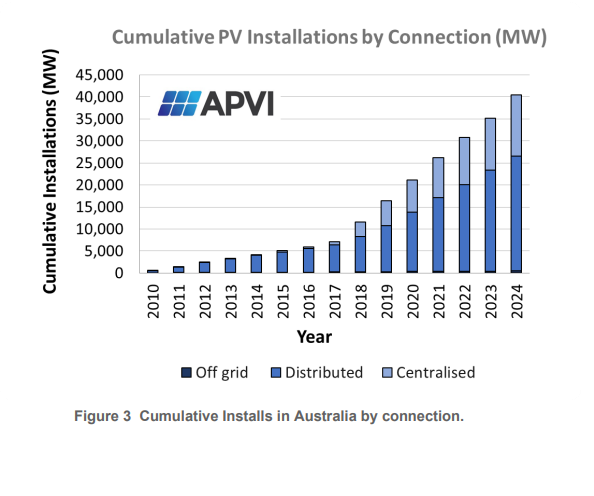
With excellent solar irradiation conditions, this capacity now meets over 20% of national electricity demand, creating both opportunities and challenges for grid management.
South Australia demonstrates the potential and challenges of high solar penetration, where rooftop solar alone routinely powers the entire state during midday hours, with excess generation exported to neighbouring states.
This achievement in a jurisdiction with 1.77 million residents illustrates the scalability of distributed solar resources.
Grid access reform remains incomplete following the closure of the Energy Security Board in May 2023, with each jurisdiction developing separate approaches to access arrangements. This regulatory fragmentation creates complexity and administrative overlap that could impact future development.
Several large prospective projects aimed at energy exports and green minerals processing could add 4GW annually if implemented, representing potential step-change growth for the utility-scale sector. These developments would position Australia to leverage its solar resources for industrial applications and international energy trade.


