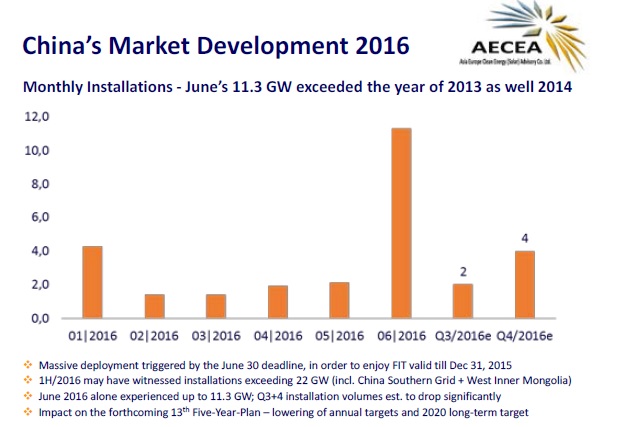
A massive 22GW of grid-connected solar projects have been logged in China’s official register for the first half of 2016.
Last week the National Energy Administration (NEA) revealed at a Chinese Photovoltaic Industry Association (CPIA) event in Beijing that 22GW, including 11.3GW in June alone, were logged in its database.
Unlock unlimited access for 12 whole months of distinctive global analysis
Photovoltaics International is now included.
- Regular insight and analysis of the industry’s biggest developments
- In-depth interviews with the industry’s leading figures
- Unlimited digital access to the PV Tech Power journal catalogue
- Unlimited digital access to the Photovoltaics International journal catalogue
- Access to more than 1,000 technical papers
- Discounts on Solar Media’s portfolio of events, in-person and virtual
While the numbers are huge, they do not directly represent the market’s end-demand with a number of factors skewing Beijing’s data.
“It's high even by China’s standards,” Yvonne Liu, Bloomberg New Energy Finance’s (BNEF) Chinese solar market analyst told PV Tech. “We expected about 18GW of grid connections in H1 2016, including 3GW that was actually built in late 2015 and only connected to the grid in 2016,” she explained.
“The NEA believes there may still be some duplicate records in their data; they describe it as 'over 20GW'. We also believe that some [of these] projects were built even before 2015 may have finally been connected in H1 2016,” said Liu.
“Another reason is that many projects are actually partially commissioned. For example, in order to connect to the grid, defined by starting power generation, by 30 June, a 10MW project might have commissioned only 7MW and leave the remaining 3MW to July or even August. But currently it is still counted as 10MW in official statistics. The NEA estimates that about 1-2GW will be removed from the 22GW in the final number,” added Liu.
What now for H2
In previous years, the holiday for Chinese New Year has seen sluggish installs on the ground during the first half of the year and a surge of activity in the second half.
“The Chinese solar market has been actively building projects in H1 2016, and we all remember past booms, for example in Germany, Italy and the Czech Republic, that were an insane amount larger than anyone realised until they were over. The challenge for companies will be in H2 2016, when we expect a major slowdown,” she said.
Frank Haugwitz, the Beijing-based founder of solar consultancy AECEA, also attended the CPIA event.
“One consequence in light of this massive deployment could be that from 2017 onwards through 2020 the annual quota could be lowered to approx 15GW per year,” he said.
The aspirational cap on support for new projects in China in 2016 is 18.1GW.
Demand versus data
The NEA data is just that. It is data in a spreadsheet tallying grid connections. To appear in the register they have to be connected, reported, the paperwork processed and then finally added to the records. This process creates a lag in all markets, between what end-demand is delivering in terms of physical build-out, and the projects that have jumped over all the bureaucratic hurdles on the way to government acknowledgement. PV Tech’s market research sister company Solar Intelligence found that the lag in the UK market was at least six months. The huge surge in registered grid connections may represent a busier H1 than China has seen in the past, but it is also heavily distorted by the quirks of the reporting process and the breach of several bottlenecks that stifled the acknowledgement of projects built as early as 2014.
“The problems of using government data as the gospel for solar market demand have been known for years, and it is disappointing that we are seeing this all over again with China, especially given the key role in China's demand levels for almost everyone involved in the industry,” said Finlay Colville, head of market research at Solar Media, the publisher of PV Tech.
“Until now, we have been sorely lacking any credible market research organization showing specific data that compares the two issues that are getting muddled up here: end-market demand – that drives supply/demand metrics at the manufacturing level – and grid-connection data that is representative of what shows up and when on official registers,” added Colville.
