
This article continues our series of features introducing new methodology that allows leading PV module producers to be categorised, ranked and short-listed by manufacturing and financial strength metrics; ultimately providing an investor-risk (or bankability) profile of PV module suppliers for non-residential end-market selection.
This is the fifth of six articles on PV-Tech.org providing full transparency on the methodology used to assign investment risk to PV module suppliers selling to commercial, industrial and utility segments of the industry. The full dataset captures research findings by PV-Tech going back more than 10 years.
Try Premium for just $1
- Full premium access for the first month at only $1
- Converts to an annual rate after 30 days unless cancelled
- Cancel anytime during the trial period
Premium Benefits
- Expert industry analysis and interviews
- Digital access to PV Tech Power journal
- Exclusive event discounts
Or get the full Premium subscription right away
Or continue reading this article for free
The first four articles focused on the manufacturing health of PV module suppliers, with the final ranking model explained in the fourth article of the series, PV-Tech research reveals ranking tool for manufacturing strength of global module suppliers, earlier this week.
This article explains the research conducted by PV-Tech to allow PV module suppliers to be grouped into three zones, through looking at the finances of companies in the sector over the past decade.
The ongoing research and methodology tracking the investment rankings of PV module suppliers will be explained in greater detail during forthcoming webinars I will deliver over 21-22 August 2019 (register here), and my opening talk at the forthcoming PV ModuleTech 2019 conference in Penang, Malaysia on 22-23 October 2019.
Methodology overview
Previous articles revealed the basic relationship between module supplier bankability (B), manufacturing (M) and financial (F) scores as:
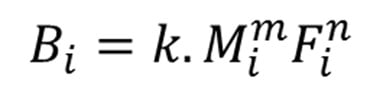
where k is a scaling factor that maps bankability scores to a 0-10 band, m and n are power coefficients derived from regression analysis, and i is a variable that is module-supplier and time-period specific. The manufacturing health score/ranking, M – and its constituent elements – were the subject of the first four articles of the series.
This article focuses on the financial score, F, needed to establish the final bankability score/rating, B.
Financial strength (F) score methodology
Most of the PV industry’s downstream community (project developers, EPC’s, and asset owners, to name just three examples) have, for many years, lacked any credible means of understanding and benchmarking PV module suppliers, with more concerns typically raised about the financial health of the companies than the state of its manufacturing output.
Some PV module suppliers (mainly the few that are currently publically-traded on US stock exchanges) tend to be scrutinised the most, but largely from an investor standpoint. For this small grouping, the financial health coverage of these companies by certain financial analysts is often of the highest standard.
However, the trend in recent years has been for leading Chinese PV module suppliers to delist from US stock exchanges. Scanning across the PV module suppliers that comprise the top-100 in the sector today, most are obviously Chinese entities operating within larger (often state-owned or controlled) organizations. As such, there has been a lack of benchmarking analysis performed, not simply regarding the financial health of the PV module suppliers (or parent organization), but across the whole range of financial and manufacturing metrics that come together to complete the bankability picture.
Therefore, it comes as no real surprise that buyers of PV modules (or the institutions that provide the financing) have been operating in a state of constant confusion. Various third-party observers have sought to create temporary solutions to this, including Top-10 shipment tables (typically of mixed quality), or tier-based listings (often with a binary yes/no inclusion and no scoring mechanism, or featuring a broad mix of module suppliers that rarely compete with one another in practice).
When it comes to benchmarking the financial health of PV module suppliers, a common technique that has been routinely applied over the past decade is the model originally developed in 1968 by Robert Altman (Altman, E.I., Journal of Finance, Vol. XXIII, No. 4, pp 589-609, 1968) as a measure of financial distress relative to potential corporate bankruptcy. Indeed, some PV module suppliers themselves have used this type of benchmarking to convey financial superiority against competitors, most often when a graphic produced by a third-party organization paints them in a positive light at the specific point the benchmarking analysis was undertaken.
The use of Altman methodology is not in question; it has been one of the most widely used tools over the past few decades to generate metrics that can track a company’s financial health (sector and turnover specific). The problem so far when applied to the PV industry (in the case of PV module suppliers in particular) is the lack of qualifiers or checks on the validity of the scoring system, and comparison with historic and current due-diligence checks on the companies in question.
The remainder of this article will explain how it is possible to retain the integrity of the Altman scoring system, but adapt this through new methodology for PV module suppliers, in a way that more accurately tracks and benchmarks the financial health of companies operating in this space.
Mapping Altman data for PV module suppliers to a new scoring system
The use Altman’s Z Score model is widespread across different sectors, and, as discussed above, the PV industry is no exception. The model was developed by Altman more than 50 years ago and was originally designed to help predict the likelihood of public-listed companies (with revenues above a certain threshold) – manufacturing specific – going bankrupt. Crucially however, the output is also a means of assessing financial strength (by default, least likely to go bankrupt during a forward-looking period).
First, however, a very quick overview of the statistical model approach. A number (Z Score) is generated for each company based on the weighted sum (linear combination) of key accounting ratios. Multiple ratios are used (multivariate in nature). The choice of ratios– and their weightings – are derived by classifying the observations (output) into different, mutually-exclusive (discriminated), qualitative, a priori groupings (safe, grey, distress zones). This explains why the statistical technique is referred to as multivariate discriminant analysis, or MDA.
The output (Z Score) is a number, and this places the company into one of the three zones; safe (>2.99), grey (1.81-2.99) and distress (<1.81), when using the original model version that applied to listed manufacturing companies. Note that the model used is absent of any constant numerical term that would shift the boundary condition between the distress zone and the non-distressed zones (grey/safe) to zero. The Z Scores represent the number of standard deviations above or below the mean of the original sample set (explaining why scores can be positive or negative).
It is simple and straightforward to generate Altman Z Scores for PV module suppliers (or corporate holding entities). The challenge is how to best interpret and understand them in context.
Indeed, it is hard to imagine that the exact 50-year old zonal categories should be instantly applicable to the PV industry of 2019, which – like any sector – is subject to its own set of dynamics, and is prone to fluctuations arising from rapid cycles in demand, policy, pricing and competition; and furthermore, is a sector that is dominated now by Chinese conglomerates (fully or part state-owned in many occasions) of which the PV module operations can be a very small part.
However, our goal here is firmly to start with the integrity and common-place acceptance of the Altman model; and then to adapt the scores to have direct meaning within the PV industry (as seen over the past decade).
The model proposed has two steps, starting from the Altman Z Scores and ending up with financial health scores (F) that rank companies between 0-10 across new zones (score bands) that align with data observed over the past decade in the PV sector (for leading PV module suppliers).
The basis of the model is illustrated pictorially in the graphic below:
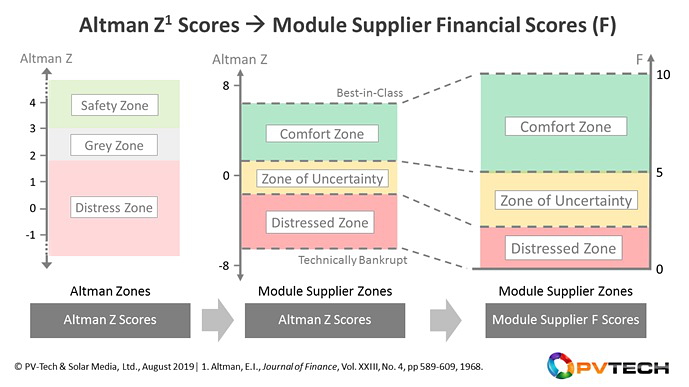
The first stage of the model involves gathering Altman Z Scores for PV module suppliers or parent companies (module warranty ‘guarantors’) where appropriate. The data collection stage here uses quarterly-reported information, as opposed to simply relying on annual (reporting period specific) information only; more on this distinction shortly.
This is where traditional approaches have basically stopped, and chosen to categorize Z Scores of PV module companies within the legacy zones. However, in doing this, typically more than 50% of the top-20 module suppliers (at any given time during the past 10 years) have been scoring at levels that would imply imminent bankruptcy. Furthermore, often the analyses have been limited to one data point per year, and are therefore highly sensitive to one particular accounting ratio that has an extreme value at that particular point in time.
The next step is to set new Altman Z Score limits that represent the ten-year upper and lower values of PV module suppliers to the industry, shown in the centre image of graphic above by the terms Best-in-Class (PV-BiC) for the upper value, and Technically Bankrupt (PV-TB) for the lower value. The technically bankrupt value is taken at the point of ‘no-return’ for the company in question, driven mainly by the fact that some of the Chinese-listed companies have tended to go into a prolonged state of financial distress as they seek to restructure operations (normally offloading assets to other existing or newly-formed entities/vehicles).
Next, it is necessary to adjust the Altman bands (safety, grey, distress) to ones aligned with PV. Here, I have retained a basic 3-level traffic-light colour-coding (green, amber, red) but have named the bands as comfort zone (green), zone of uncertainty (amber), and distressed zone (red). The renaming here is a minor cosmetic adjustment to assign more accurate descriptions to PV module suppliers’ business models: the main change relates to altering the Altman score values that were applied to the boundaries of the safety/grey (2.99) and grey/distress (1.81) zones.
So far, we have not done any adjustment to the Altman Z Scores themselves, other than rework the three zones and place upper and lower bounds, as shown by the mapping of the left image above to the centre one. The renaming of the mid band to zone of uncertainty is done because this terms more accurately sums up what has been seen in the last decade in the sector. PV module suppliers in this band can be seen to either recover operations (move up to the comfort zone) or descend rapidly (ultimately becoming unbankable for project deployment).
The next step to the model turns out to be useful as a visual tool in the final F score output analysis (simple 0 to 10 scoring), but is essential in being able to combine financial health (F) with manufacturing health (M), in order to derive the final bankability factor (B); and ultimately to allocate a risk designation to provide a guide to the investor community when looking at PV module suppliers for site selection.
This involves assigning PV financial scores (F) in the 0-10 band, with F scores above 5 all falling into our comfort zone, and the other zones in the 0-5 range.
Mapping Altman Z Scores (now labelled simply as A for the analysis) to our new PV financial health scores (F) is not linear in nature (in part due to the change in zone ranges and limits imposed above), but can be done relatively easy through a few simple mathematical procedures, as outlined below now.
The mapping process can be expressed as:
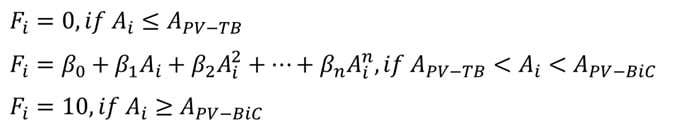
The key term above (in the middle) is best mapped through a polynomial of order n (coefficients given by the β terms).
The best-fit solution to the polynomial is now determined by approximating the upper and lower values of F (10 and 0) to successive local minima/maxima, mapping the boundary data sets (distressed/uncertainty and uncertainty/comfort), and finally reducing to a set of simulations equations that can be readily solved.
This now allows us to take any Altman Z Score of a PV module supplier, and map it to a PV-specific 0-10 scale, where anything above 5 is representative of a PV module company operating financially in an industry comfort zone.
A final correction turns out to be needed when looking at the overall analysis, to remove any one-off accounting issues and smooth out seasonal lumpiness that tends to characterize PV module suppliers whose corporate entities have a strong weighting to PV related business. To account for this, trailing twelve months (ttm) averages are taken, based on the previous four calendar year quarters, at each quarter-end.
While several of the Altman based values are cumulative in nature (and therefore largely invariant to doing quarterly or annual scoring calculations), Z Scores can swing from quarter to quarter, or when simply taking single datapoints from annual filings. One key entry here relates to company valuation (market cap) and share prices used to derive this at any given time. It turns out that it is preferential to have more frequent Z Score refreshes (quarterly at a minimum) than rely simply on a Z Score once a year, when using the market cap at this one point in time.
The ttm averaging process can be done either before or after the mapping step. I have chosen to implement this once the F scores have been derived from the quarterly Z Scores.
In this way, the resulting F scores show a clearer long-term trend, and would appear to prevent the often-cited industry practice of taking one-off Altman Z Scores of companies and rushing to quick conclusions that are not representative of long-term factors.
To convey this point, consider the graphic below where two multi-GW suppliers to utility-scale solar over the past 5-10 years are analysed using the new model. We have confined the output here to seven quarters up to end Q1’19, simply to best visualize the issues discussed above.
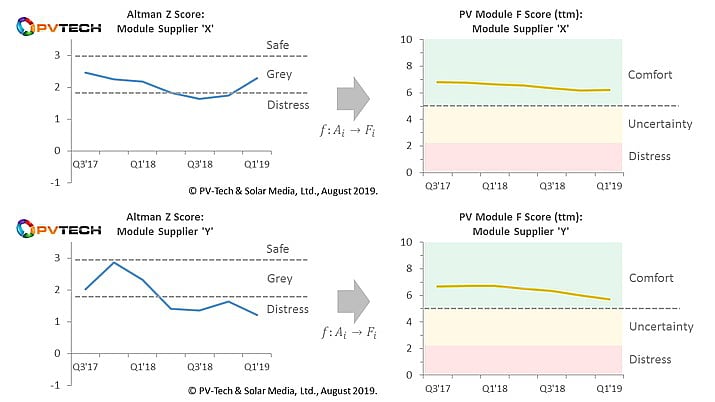
Each of the time-period specific case-studies in the graphic above serves to illustrate how taking the Altman Z Scores at face-value (and purely based on quarterly datapoints) can lead to erratic – and sometimes erroneous – conclusions regarding the financial health of PV module supplier companies (or parent guarantor entities).
While the above analysis has been confined largely to the mechanics behind the mapping process, the ultimate validity can only come from looking at the results from an extensive dataset of leading PV module suppliers going back in time, and assessing if the current scores reflect what is happening in the market in 2019. This is now reviewed in the final section of the article.
Manufacturing strength (M) score output
The following graph shows a subset of leading companies, where we have chosen mainly GW-scale PV module suppliers (during the past few years) that have been featuring prominently on the bankability short-lists of various lenders. In addition, one module supplier was chosen that was suspected to be in the zone of uncertainty for the past couple of years.
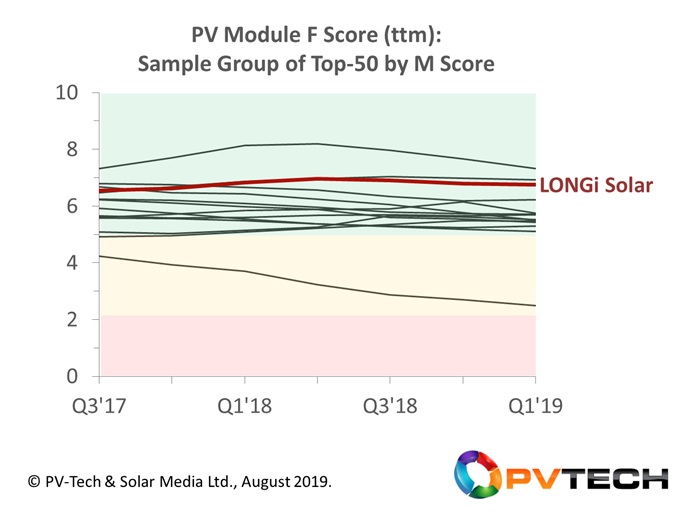
With all of the companies we selected here (except for the one selected that was known to have areas of concern) falling into the comfort zone region (and many just hovering above the uncertainty zone), this would appear to be an excellent validation of the scoring system we intent to use as part of the bankability ratings, to be explained in the final part of the blog series this week on PV-Tech.
Furthermore, F scores are shown to follow more graduated trending, compared to the lumpy output that can arise from benchmarking companies purely on Altman Z Scores at a specific point in time.
In the graph above, we have chosen to highlight/label LONGi Solar, as one of the few companies whose F score has been consistently in the mid-range of the comfort zone band. Again, knowledge of the company in question here is another validation that the model is tracking real-world industry activity.
Another key scenario we had to factor in was the case of a company whose F scores started in the comfort zone, moved downward to the zone of uncertainty, and then fell into the distressed zone. This is clearly an extremely important leading indicator within the PV industry, and in part forms the basis of what has been the most frequently cited concern of the investment community, normally along the lines of: “How do I know the module supplier I have chosen is not going to go bankrupt?”
This issue is of course why so many people gravitate to the scoring system and zonal categories created by Altman in the first place, and apply these to the PV module suppliers or the parent entity as the guarantor.
It would obviously be great if life was so simple that bankruptcy could be predicted, but this is not why the F scoring system for PV module suppliers has been established. It is firmly to track and benchmark the financial health (on a 0-10 scale) of PV module suppliers, within the overall bankability rating system.
Ultimately, companies failing to emerge from the distressed zone should simply be assigned a risk parameter that feeds into any due-diligence exercise, and likely eliminates the company in question from any short-listing in the first place.
Whether the company goes bankrupt is immaterial. Everything is about risk and being able to benchmark this for any initial short-list of PV module suppliers under consideration. Indeed, anyone looking at the PV industry over the past decade knows that bankruptcy is far from a binary transition process.
Previewing the next part of the article series
The final article (part six) will explain how the manufacturing strength (M) and financial strength (F) values are combined to form an overall bankability/risk score for PV module suppliers (B), offering the first fully-researched benchmarking tool for investors, developers, EPCs, and asset owners of global solar PV sites today.
Attend PV ModuleTech 2019 to hear the first presentation on the findings
The full results of the overall study will be released by the PV-Tech market research team before the end of August, with the key findings presented, explained and discussed in the 45 minute opening talk I will be giving at the forthcoming PV ModuleTech 2019 event in Penang on 22-23 October 2019.
PV Tech’s bankability analysis series links are below
Part 1. PV-Tech research set to reveal investment grades for global PV module suppliers
Part 2. PV-Tech research reveals how to assess PV module suppliers’ capacity claims
Part 3. PV-Tech research establishes technology-leadership scorecard for top-100 module suppliers
Part 4. PV-Tech research reveals ranking tool for manufacturing strength of global module suppliers
Part 5. PV-Tech research ranks PV module suppliers by financial health
Part 6. First PV module supplier bankability ratings tool created by PV Tech research team


")
