While the potential of floating solar is in little doubt, less studied are the optimal combinations of technologies such as trackers and bifacial modules. Carlos Rodriguez, Oktoviano Gandhi and Sun Huixuan examine the energy yield performance of different system configurations and how those could enable floating PV to fulfil its potential.
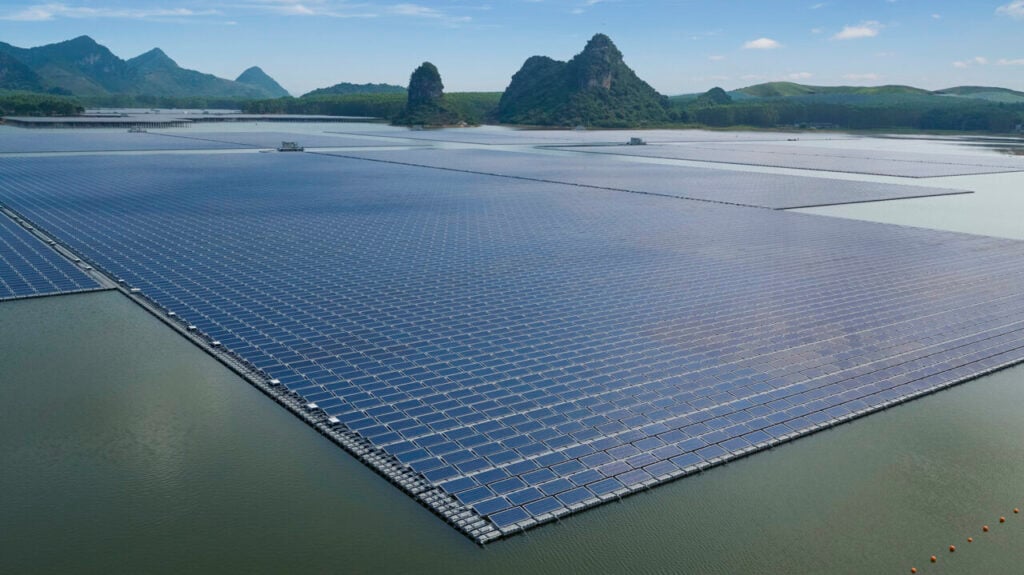
The transition to 100% renewable energy is crucial for addressing climate change and energy security. Solar energy has become one of the most affordable sources of electricity worldwide, surpassing wind in global installed capacity in 2021 [1]. However, PV systems require large areas, posing challenges in land scarce countries such as Japan and the Netherlands. Floating PV (FPV), which utilises water bodies for installation, addresses this challenge while offering additional benefits, such as reduced module temperatures, faster deployment and improved water security.
Try Premium for just $1
- Full premium access for the first month at only $1
- Converts to an annual rate after 30 days unless cancelled
- Cancel anytime during the trial period
Premium Benefits
- Expert industry analysis and interviews
- Digital access to PV Tech Power journal
- Exclusive event discounts
Or get the full Premium subscription right away
Or continue reading this article for free
Despite the growing interest in FPV, previous studies have focused on fixed-tilt angles and not considered emerging technologies such as trackers and bifacial panels, which could significantly enhance energy generation. This study aims to fill this gap by analysing FPV configurations—including tracking and bifacial panels—across 249,717 inland reservoirs, covering 2.2 million km², and assessing their potential to meet global electricity and water needs.
Bifacial and tracker technologies
Bifacial panels now dominate solar panel production, accounting for 50% of the market in 2023 and expected to rise to 70% by 2028 [2]. Glass-glass bifacial panels offer advantages such as lower degradation rates and improved efficiency due to reduced temperature. Although the bifacial gains in FPV systems vary, some studies report up to a 5.24% [3] increase in energy production, particularly with reflectors and tracking.
Tracking systems also boost FPV performance. Dual-axis tracking can increase energy output by up to 40%, while single-axis tracking yields around 25% [4]. However, trackers may increase system costs and technical complexity, including the need for stronger floats and anchoring systems. Despite these challenges, the benefits of bifacial panels and tracking systems highlight the importance of incorporating these technologies in future FPV research.
Therefore, while FPV’s energy generation potential is influenced by various factors like tilt angle and location, incorporating bifacial panels and trackers offers significant performance gains. Future research should consider these technologies to optimise FPV configurations for specific project needs.
Reservoir database
Figure 1 presents the global reservoir database, where grey areas represent reservoirs with a minimum daily ambient temperature (Tmin) below 0°C, indicating potential ice formation. These reservoirs face increased design and operational complexities, raising investment and maintenance costs. Some FPV systems have already been installed in cold regions, such as a 448kWp system in Lac des Toules, Switzerland (2019), with plans for expansion to 10MWp. Other FPV systems have been deployed in similar climates, including a 160kWp system in Fukushima, Japan (2018), and 300kWp and 500kWp systems in Heilongjiang, China. However, it’s important to note that ice formation depends on factors such as water flow and wind speed, so not all reservoirs with Tmin < 0°C will freeze.
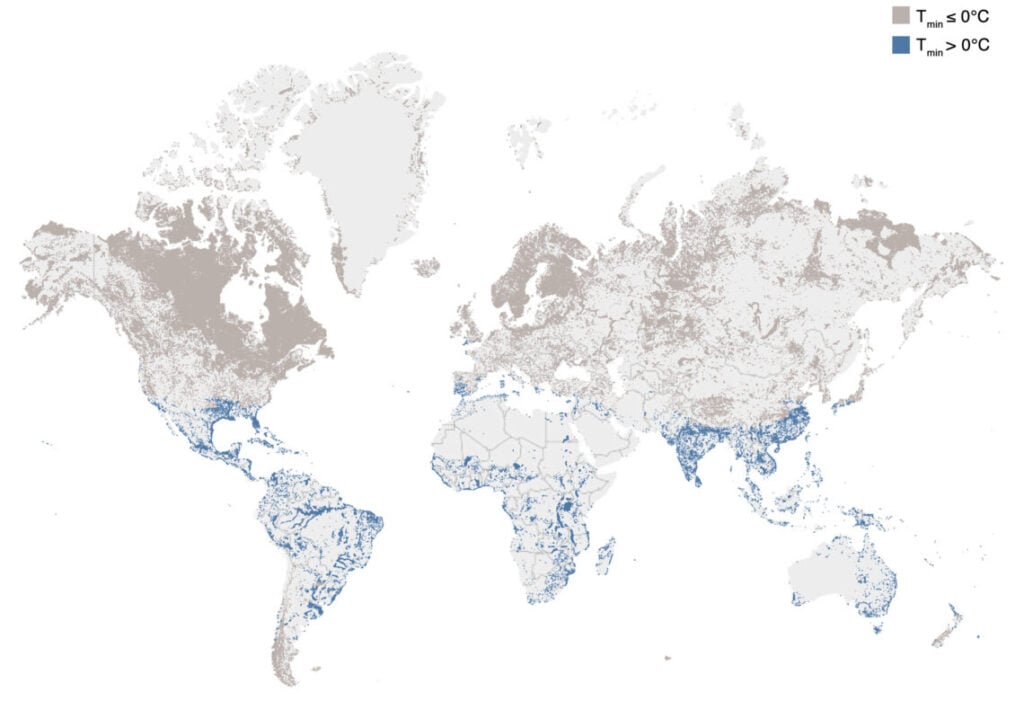
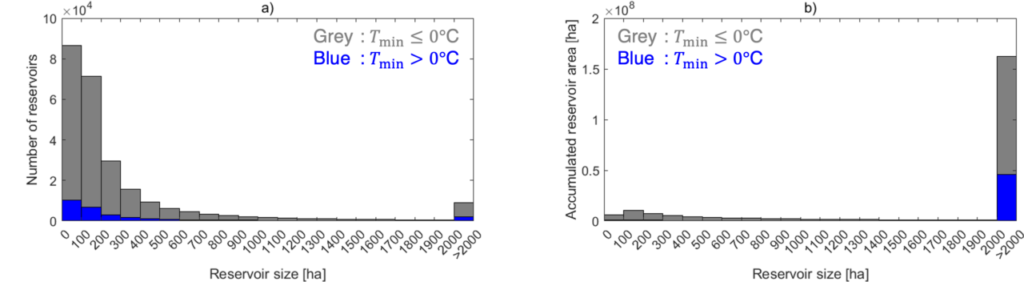
Figure 2 shows the number and cumulative area of reservoirs by size. Approximately 85% of global reservoirs are small (<500 ha), but large reservoirs (>2,000ha) account for 73% of the total area. Notably, 88% of reservoirs (by number) and 76% (by area), particularly in Canada, Russia and Nordic countries, may experience ice formation. Further details on the different database considered in this study can be found in [5].
FPV system configurations
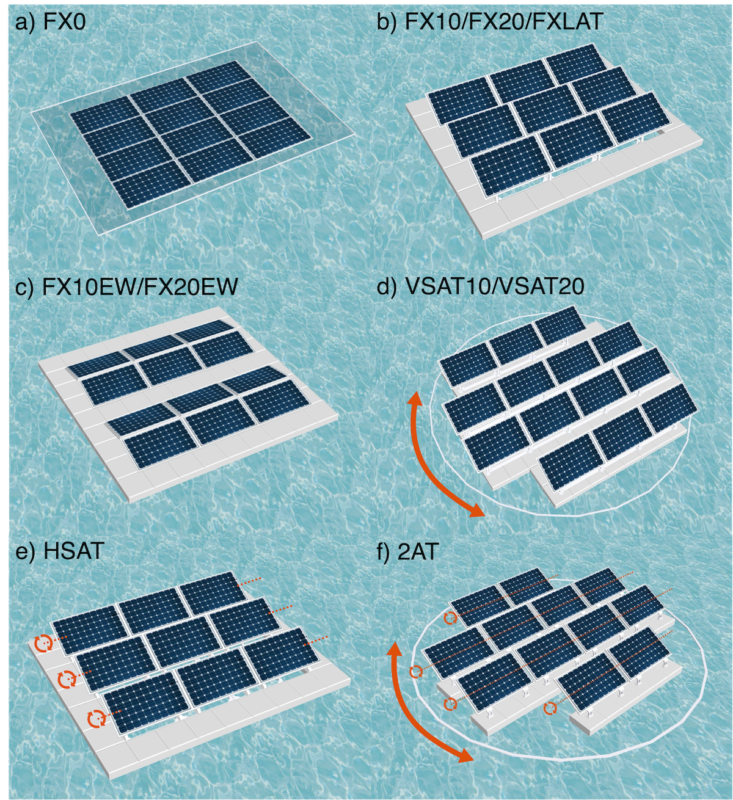
As FPV systems with trackers gain traction (with 23 systems totalling 26.5MWp installed by 2023), this article evaluates the energy potential of both fixed-tilt and tracking FPV systems. Table 1 outlines the configurations considered in the analysis.
| FPV configuration name | Solar panel tilt angle and orientation |
| FX0 | Fixed 0° tilt (horizontal) |
| FX10 | Fixed 10° tilt facing the equator |
| FX20 | Fixed 20° tilt facing the equator |
| FX10EW | Fixed 10° tilt with East-West orientation |
| FX20EW | Fixed 20° tilt with East-West orientation |
| FXLAT | Fixed-tilt angle equal to latitude, facing equator |
| VSAT10 | 10° tilt with vertical single-axis tracker |
| VSAT20 | 20° tilt with vertical single-axis tracker |
| HSAT | Horizontal single-axis tracker (−60° to 60° tilt) |
| 2AT | Dual-axis tracker (both vertical and horizontal axes) |
Figure 3 illustrates these configurations. Fixed-tilt systems like FX10 and FX20 are common, while FX10EW and FX20EW configurations are commercially available from companies such as Scotra and Zimmermann. FX0 systems are provided by Ocean Sun and Inseanergy, and FXLAT is typically applied in land-based PV (LBPV) systems but is less common for FPV due to mechanical constraints at high latitudes. Tracking systems such as vertical single-axis (VSAT) tracking have been used since the early years of FPV. Newer systems like horizontal single-axis tracking (HSAT) and dual-axis tracking (2AT) offer increased energy generation potential, although they pose challenges to system stability and design complexity. Manufacturers such as SolarisFloat are developing 2AT solutions, which adjust to maximise irradiance capture.
Global FPV potential
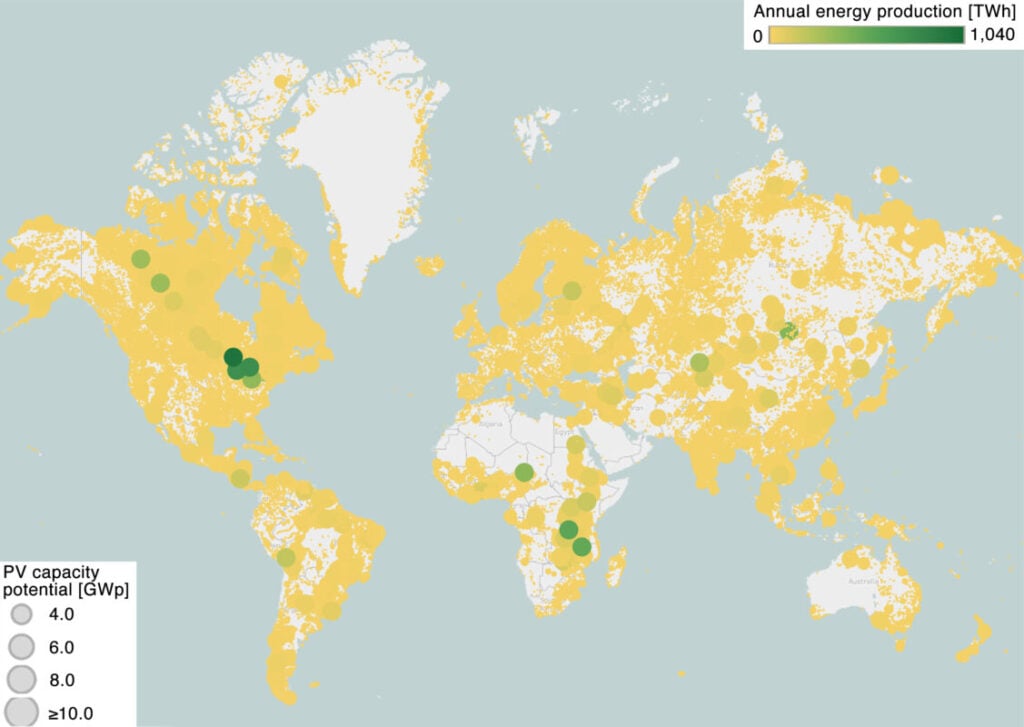
This section examines the upper limit of FPV installations and the performance of various configurations. Figure 4 illustrates the FPV installation capacity (circle size) on reservoirs globally, covering 10% of their area. Assuming a power density of 1MWp/ha (100Wp/m²), global FPV potential exceeds 22TWp, over 2,800 times the total FPV capacity installed by 2023 (7.68GWp, according to SERIS) and more than 14 times the combined capacity of terrestrial PV systems (land-based PV + water-based PV). The estimated annual energy production, based on monofacial panels and 10% coverage (FX10 configuration), is shown by the circle colour. FX10 systems could generate over 28 petawatt-hours (PWh) annually, enough to meet the energy needs of many countries, despite being smaller than global LBPV potential (33–4,105PWh).
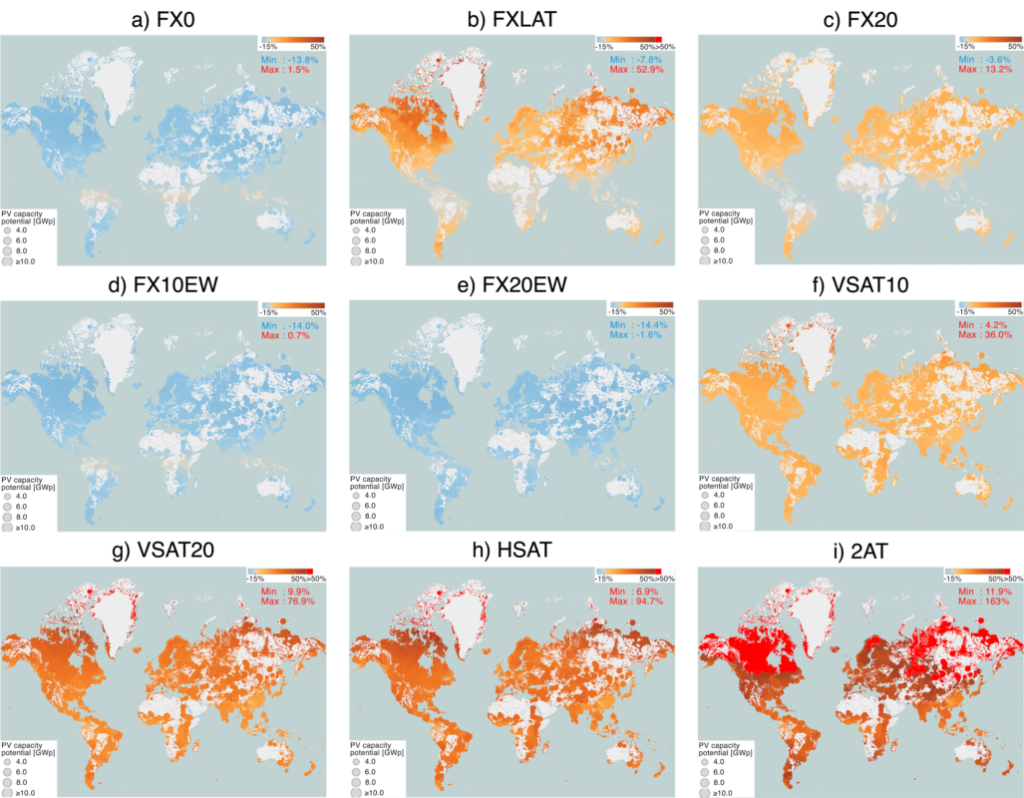
Figure 5 compares the energy production of various FPV configurations, showing that performance varies with latitude. Figure 6 presents the average energy yield of different configurations based on latitude for all inland reservoirs, indicating how different configurations perform across the globe.
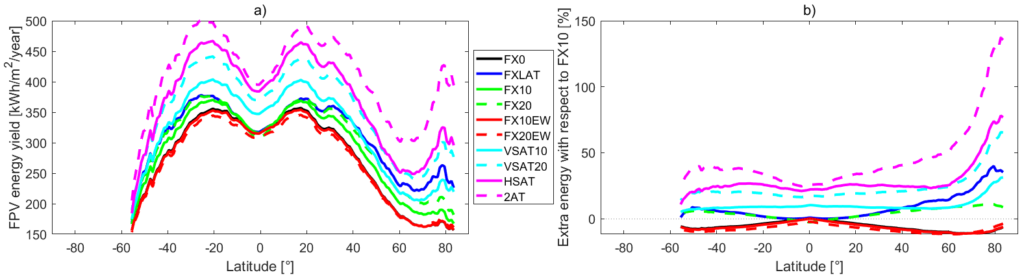
Key takeaways from Figures 5 and 6:
- East-West configurations (FX10EW, FX20EW) produce less energy than FX10 at all latitudes. FX20EW performs the worst for most locations, only outperforming FX10EW at latitudes above 70°.
- FX10 systems outperform FX20 configurations at latitudes around 10°, but due to their steeper tilt, FX20 systems generate more energy at higher latitudes.
- Tracking systems (VSAT, HSAT, 2AT) consistently outperform fixed-tilt systems. Vertical single-axis tracking (VSAT10) yields more than FXLAT at latitudes between −40° and 40°. HSAT and 2AT configurations perform best overall, especially at higher latitudes.
- FXLAT configurations yield similarly to FX10 and FX20 within ±30° latitude but significantly more at latitudes beyond this range, with up to 52.9% higher yield compared to FX10.
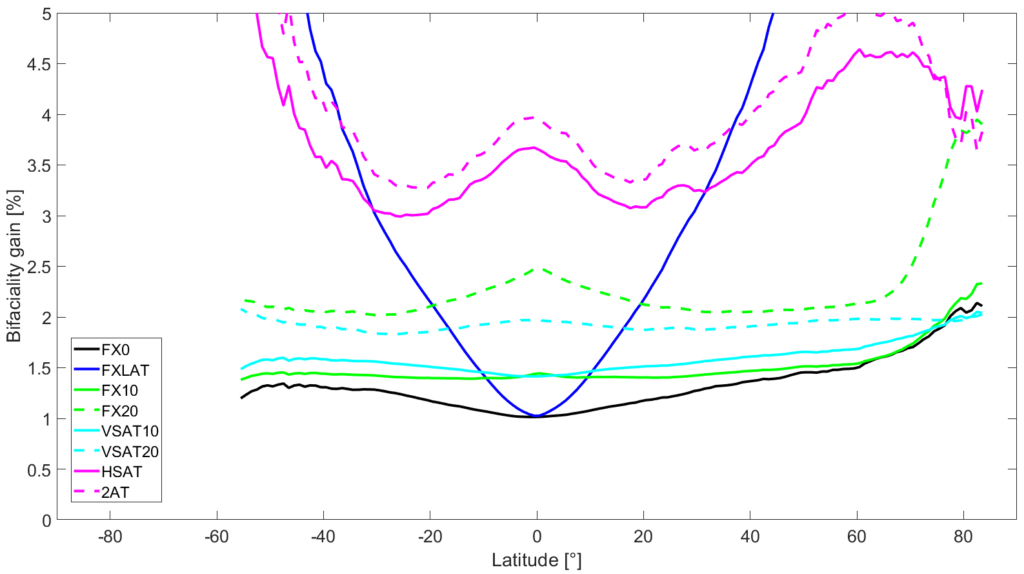
Considering bifacial panels, Figure 7 shows the average bifacial gain based on latitude. Key outcomes:
- Bifacial gains increase with latitude for configurations like FXLAT, HSAT, and 2AT, peaking at 34% for FXLAT at 83.5° latitude.
- For latitudes below 60°, bifacial gains are generally below 2.5% for 10° and 20° tilt systems.
- HSAT outperforms VSAT20 in bifacial gain, making it more favourable for bifacial panels.
These results suggest that the energy boost from bifacial panels in commonly used configurations (FX10, FX20) is modest (typically below 2.5%). The lower bifacial gains in this study may be due to conservative albedo assumptions, but other benefits, such as lower degradation rates, make bifacial panels advantageous for FPV systems.
Ultimately, FPV project developers can determine the most optimal system configuration based on energy generation potential and site-specific factors, such as wind speed, water depth and anchoring costs.
FPV potential in fulfilling global energy and water consumption
FPV has the potential to meet global electricity demand, with up to 22TWp available by covering just 10% of inland reservoirs. This section analyses FPV’s potential to enhance energy and water security for each country.
Figure 8 presents FPV potential by country, considering all reservoirs (Figures 8(a)–(e)) and only those with Tmin > 0°C (Figures 8(f)–(j)). The analysis assumes FPV coverage of 10% of reservoirs. Figure 8(a) shows the FPV capacity per country, while Figure 8(b) highlights the energy production potential using FX10 systems. The highest values are seen in Canada, the USA, Russia, Brazil and China. Figure 8(c) shows the percentage of each country’s electricity demand that could be met by FPV, with many Latin American, African and northern countries (e.g., Canada, Russia) able to fully satisfy their needs.
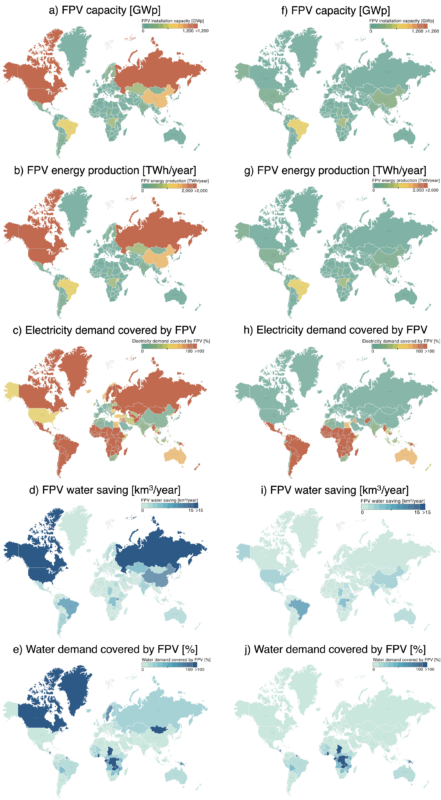
In addition to energy generation, FPV systems can reduce water evaporation. Small-scale studies show reductions ranging from 17% to 90%, with some experimental findings suggesting up to 95%. This potential is quantified in Figures 8(d) and (i), with countries that have high energy production potential also showing high water savings. Figure 8(e) indicates the percentage of each country’s water consumption that could be met through FPV’s evaporation reduction, with several countries (e.g., Canada, Mongolia, Uganda) potentially fulfilling all their water needs.
When considering only reservoirs with Tmin >0°C, FPV potential in high-latitude countries (e.g., Canada, the US, Russia) decreases significantly, as seen by comparing Figures 8(a)–(e) with Figures 8(f)–(j). However, FPV installations are still feasible in these regions, though they may incur higher costs and operational complexities if ice forms. Notably, the Netherlands, with all its reservoirs below 0°C, is among the top 10 regions by installed FPV capacity (303.6MWp by 2023).
While Figure 8 illustrates the electricity and water demand that FPV could meet, it does not account for the distance between reservoirs and demand centres. It is likely that reservoirs near demand centres will be prioritised for FPV installations, with more remote locations becoming viable as clean energy and water needs increase, alongside advancements in FPV and transmission technologies.
Conclusion
This study estimates the global FPV potential using data from 249,717 inland reservoirs, covering 2,220,623km². With ust 10% of reservoir areas covered, FPV installations could reach 22TWp—more than 2,800 times the global installed FPV capacity of 7.68GWp by 2023 and over 14 times the cumulative terrestrial PV capacity. Analysis of the performance of FPV systems with various tilt angles and tracking approaches (VSAT, HSAT, 2AT) shows that trackers can boost energy yield by up to 163% for 2AT systems at latitudes beyond 80°. Bifacial gains increase with tilt angles, ranging from 3% to 7.5% globally for HSAT and 2AT systems.
The analysis suggests FPV could meet 100% of global electricity demand and 5% of water demand by covering just 10% of inland reservoirs. These insights provide a reliable reference for stakeholders, researchers and regulators. As PV deployment grows, it is crucial to assess real-world FPV installations to optimise design, installation and maintenance, and address environmental impacts. Clear regulatory frameworks for FPV installations, operations and compensation are also necessary. FPV should be seen not as a competitor to land-based PV, but as a complementary solution to accelerate global electricity decarbonisation in areas where traditional PV is impractical or uneconomical.
References
[1] IEA, 2022, “Renewables 2022: Analysis and forecast 2027”, Tech. rep., International Energy Agency (IEA), Vol. 1, No. 1, pp. 1-159
[2] Fischer, M., et al. 2024, “International Technology Roadmap for Photovoltaics (ITRPV) 2023 Results”, Tech. Rep. May, VDMA, Vol. 15, No. 1, pp. 1-82
[3] Tina, G.M., et al. 2021, “Analysis of water environment on the performances of floating photovoltaic plants”, Renewable Energy, Vol. 175, No. 1, pp. 281–295
[4] Tina, G.M., et al. 2022, “Energy performance analysis of tracking floating photovoltaic systems”, Heliyon, Vol. 8, No. 8, pp. 1-11
[5] Rodríguez-Gallegos, C.D., et al. 2024, “Global floating PV status and potential”, Progress in Energy, Vol. 7, No. 1, pp. 1-48
Authors
Dr. Carlos Rodríguez is the head of yield and performance – Australasia at RINA. He holds a master’s degree from University Ulm and Fraunhofer ISE, and a PhD from the National University of Singapore and the Solar Energy Research Institute of Singapore (SERIS). He specialises in the design, optimisation and simulation of various PV system technologies, contributing to over 10GWp of projects worldwide.
Dr. Oktoviano Gandhi is a senior research fellow at SERIS. He earned a Master of Physics from the University of Oxford and a Ph.D. in Solar Energy from NUS (Valedictorian). His work encompasses solar cell design, PV systems (including floating) analysis, energy storage and power system operations, and energy policy.
Dr. Sun Huixuan is a research fellow at the SERIS. Her research specialises in urban solar modelling, geospatial-based solar feasibility analysis and visual impact assessment. She develops advanced 3D glare analysis tools to enhance sustainable urban planning and support renewable energy deployment.


