
In the photovoltaic (PV) industry, it is standard practice to perform detailed energy yield simulations based on one year of operation, using the Long-Term Average (LTA), and to apply PV module degradation to PV power output (PVout) during post-processing to estimate future yields. However, as PV modules age, their performance naturally declines in a nonlinear way, and this degradation has an indirect and nonlinear impact on PVout.
While this is a well-known phenomenon, to explicitly quantify these long-term effects, we at Solargis conducted comprehensive research that was presented at the 2025 European PVPMC.
Try Premium for just $1
- Full premium access for the first month at only $1
- Converts to an annual rate after 30 days unless cancelled
- Cancel anytime during the trial period
Premium Benefits
- Expert industry analysis and interviews
- Digital access to PV Tech Power journal
- Exclusive event discounts
Or get the full Premium subscription right away
Or continue reading this article for free
The broader study analysed three diverse geographical sites to capture different climatic behaviours—Petrolina (Brazil), Wagga Wagga (Australia) and Penang (Malaysia)—utilising historic time series data ranging from 18–26 years. To illustrate the real-world impact of our findings, this article focuses on our results from the Petrolina site, which showcases how these climatic and degradation patterns intersect.
Our research reveals a surprising side effect: degradation fundamentally changes the way inverters behave over time, and current industry practice for calculating this might be wrong by more than 3%.
Degradation influences inverter clipping losses and energy yield predictions
To maximise a grid connection, engineers typically “oversize” the DC solar array relative to the AC inverter capability (a high DC/AC ratio). Inverter clipping happens when the solar panels produce more DC power than the inverter can handle.
The inverter basically “clips” the excess energy by shifting its operating point so the surplus DC power is never converted and injected into the grid. While some clipping is expected and even financially optimal in the first year(s), its behavior changes significantly as the PV power plant gets older. This means the “effective” DC/AC ratio of the plant actually decreases every year.
Over a 25-year lifespan, this reduction in clipped energy can easily reach 2–3%. While “less clipping” sounds like a good thing, the way we calculate it today often leads to a false sense of security regarding long-term revenue.
Analysing the long-term effects of PV module degradation requires sub-hourly, high-resolution data to capture the fine details that standard hourly models miss. To investigate this, our study performed simulations using multi-year time series and TMY (Typical Meteorological Year) satellite-based data, with 1-minute and 15-minute time resolutions.
Why ‘industry standard’ data misses the mark on clipping
How much energy a power plant will lose to inverter clipping depends on the technical setup (primarily the DC/AC ratio), on the variability pattern of Global Horizontal Irradiance (GHI) and on the degradation.
The amount of sunlight reaching the modules isn’t steady; it fluctuates constantly as clouds pass by. If using standard hourly or even 15-minute TMY data, these quick “flickers” of intense sunlight get averaged out. Depending on the technical setup and degradation, the averaging of those peak moments of intensity due to using low-resolution data may essentially “hide” the spikes that would have been clipped.
To get an honest result, our researchers found that 1-minute data is the gold standard. Without this sub-hourly precision, you risk overestimating your actual power output because the simulation simply doesn’t “see” the energy being lost at the inverter.
As for the aging solar modules, they degrade over time and they exceed the inverter’s capability less often. Essentially, a power plant’s effective DC/AC ratio drops every year. Over the lifetime of a project, this shift can reduce clipping losses by 2–3%. For example, in a system with a 1.25 DC/AC ratio, the number of times the power hits the inverter limit in the final year of operation is significantly lower than on day one. If your long-term simulation doesn’t account for this gradual “shrinking” of the power peaks, your 25-year revenue forecast will be built on a technical inaccuracy.
This exact disparity is illustrated in Figure 1, below, which contrasts the intra-day power generation between a system’s first and final year of operation.
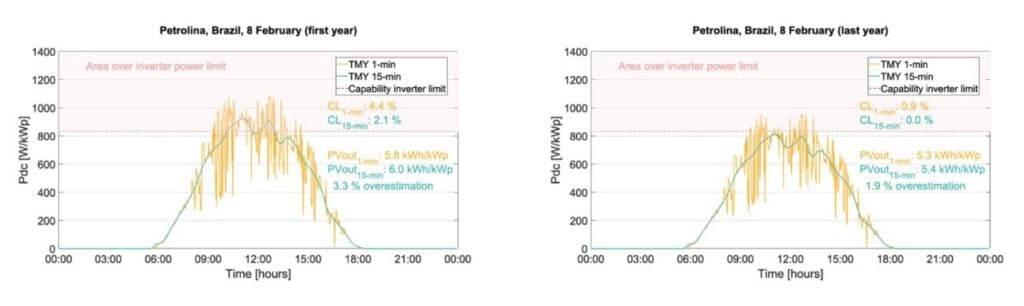
The graphs show how 15-minute data (the blue line) smooths out the severe peaks captured by 1-minute data (the yellow line), leading to a 3.3% overestimation of output on day one, which drops to 1.9% by the final year as degradation shrinks those power spikes.
How clipping losses change over time
Through running the simulations with both historical time series and TMY datasets, our researchers discovered three critical trends in how clipping losses (CL) evolve during a project’s lifetime:
- The use of 15-minute data may introduce an aggregation bias (depending on the system’s DC/AC ratio and local climatic conditions) particularly in locations with high intra-hour variability. This averaging effect can smooth out transient irradiance peaks and leads to an underestimation of clipping losses compared to using a high-resolution simulation.
- While TMY data represents one “typical” year, it cannot realistically capture the year-to-year changes in clipping that occur with actual weather variability (unlike high-resolution time series).
- Even if solar panels degrade at a steady, linear rate (e.g., 0.5% every year), clipping losses would not decrease in a straight line. The reduction in clipping is non-linear, meaning it happens at a different pace than the degradation itself. This effect is most visible in systems with lower DC/AC ratios (between 1.2 and 1.4), where even small changes in panel performance significantly shift how often the inverter hits its limit.
As shown in Figure 2 below, this non-linear drop-off behaves entirely differently depending on how the system is designed.
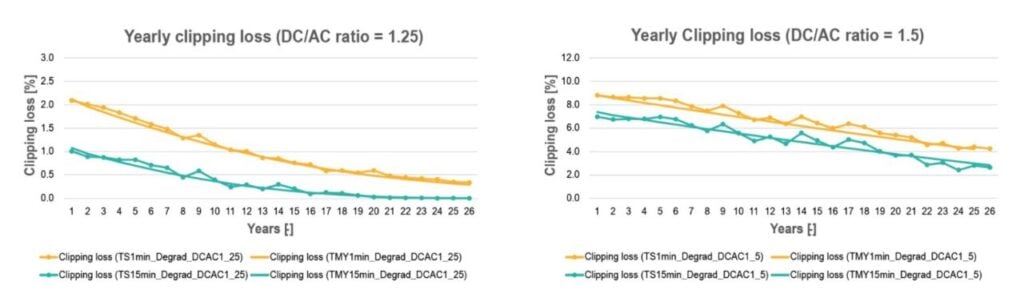
The gap between 1-minute and 15-minute datasets is persistent across the entire 26-year timeline, with the lower DC/AC ratio system (left) experiencing a much faster relative collapse in clipping occurrences than the heavily oversized system (right).
The effect of clipping losses on PV power output and future yields estimation
Comparing 1-minute data to 15-minute data a clear shift is visible in both the calculated clipping losses and the total PVout. While many factors are at play, the system’s DC/AC ratio determines how much this data resolution actually matters to the final numbers:
- The DC/AC ratio is a primary driver determining how much clipping error affects the total output.
- In systems with a lower DC/AC ratio (e.g., 1.25), the role that clipping plays in overall energy calculations drops off much faster than in highly saturated systems (e.g., 1.5).
- Systems with lower DC/AC ratios are much more sensitive to year-to-year weather changes. Because these systems aren’t always “maxing out” their inverters, any small change in cloud cover or sunlight intensity significantly shifts the final energy production.
Using granular 1-minute data ensures that these sensitivities are accurately captured, preventing surprises when actual weather patterns differ from long-term averages.
Figure 3 below quantifies how this translation from clipping errors directly impacts your bottom-line PVout calculations over time.
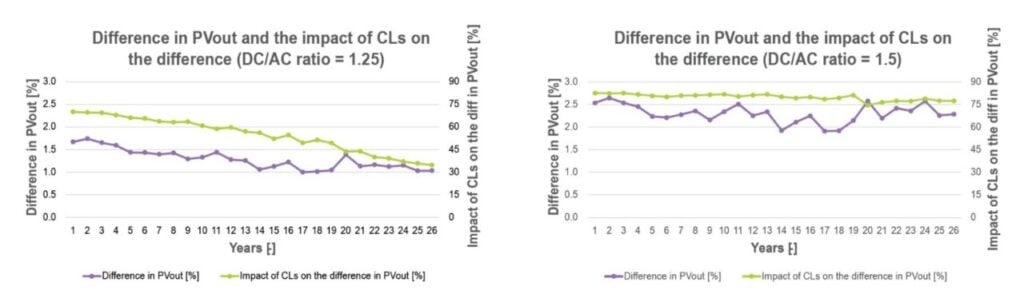
In a 1.25 DC/AC ratio system (left), the impact of clipping losses on total yield discrepancies declines sharply over 26 years, whereas in a 1.5 DC/AC ratio system (right), clipping remains the dominant driver of yield errors, holding steady at a high percentage throughout the entire lifetime.
As for estimating future energy yield, the current industry practice is for engineers take the LTA and subtract a flat percentage for panel aging (degradation) every year. However, this “one-size-fits-all” approach can lead to an overestimation of future yields.
The analysed cases showed an overestimation in future yield predictions of up to 3.6%. Because the range of differences varies with the site and the technical configuration, the best practice is to analyse each site separately and avoid generalising the study’s results. There is no universal “correction factor” because the error changes based on the specific site and the technical setup of the equipment.
Instead of applying a flat deduction at the end, degradation should be modeled as a dynamic part of the simulation itself. By moving away from simple post-processing and looking at each site’s unique weather patterns and hardware configuration, developers can avoid expensive “performance surprises” ten or twenty years down the line.
Authors
Jozef Rusnak is a technical consultant at Solargis and Branislav Schnierer is the head of consultancy at Solargis. Read more about the company’s research into the topic of clipping losses here.