Presenting findings on the exposure of PV panels to the harsh environment of the Arabian Desert, a team from the Qatar Environment & Energy Research Institute details the multiple mitigation approaches to solar soiling.
In 2016, the Paris Agreement acknowledged the need to restrict the maximum global average temperature rise to 1.5°C. However, the current policies to limit global greenhouse gas emissions due to the burning of fossil fuels are still insufficient to maintain the temperature increase below 2°C. Therefore, the decarbonisation of energy systems is currently the only available option to achieve this target. Towards such a goal, we are now welcoming the new terawatt era of photovoltaic (PV) solar energy.
Try Premium for just $1
- Full premium access for the first month at only $1
- Converts to an annual rate after 30 days unless cancelled
- Cancel anytime during the trial period
Premium Benefits
- Expert industry analysis and interviews
- Digital access to PV Tech Power journal
- Exclusive event discounts
Or get the full Premium subscription right away
Or continue reading this article for free
In fact, the world’s cumulative installed solar PV capacity grew by 22% to reach 940GW by the end of 2021, representing a 56% share of all renewable energies [1]. By May 2022, the installed capacity surpassed the milestone of 1TW, led mainly by the deployment of large utility-scale solar plants. The state of Qatar, like the other Middle East and North Africa (MENA) countries, has a large potential for deployment of solar energy production due to the very high solar irradiations with the lowest levelised cost of electricity (LCOE), becoming an emerging PV market [2-4]. The average annual global horizontal solar irradiation goes up to 2286 kWh m−2 with an associated annual PV electricity production potential of 2100 kWh/ kWp for c-Si modules [5]. Solar tender results provide testimony for the growing competitiveness of solar technology around the world, with new record-low solar tariffs registered in 2021 with the top four lowest bids in desert areas [1].
In 2008, the state of Qatar launched the Qatar National Vision 2030, setting a national target of 20% renewable energy by 2030 and a 10GW target for solar energy, and aimed at increasing PV adoption as part of the global transition towards a net zero carbon emissions. Qatar has a clear commitment to the implementation of PV solar plants in the country as proven by the inauguration in October 2022 of one of the largest PV plants in the world, Al-Kharsaah, which has a capacity of 800MWp and represents 10% of the country’s demand. Two more projects starting in 2023 in Ras-Laffan and Mesaieed will account for 875MWp and will be finished by the end of 2024.
However, soiling of solar collectors has been recognised as the main issue and the biggest detriment for solar energy systems operating in the MENA region, which results in significant losses of solar power generation and an increase of associated operational and maintenance (O&M) costs [2]. For instance, soiling is estimated to have reduced global solar power production by at least 4% [2], causing a conservative global revenue loss of more than €7 billion (US$7.3 billion) by 2023 [2].
PV soiling is a multidimensional and dynamic phenomenon, influenced by site characteristics, weather conditions, surface material and dust particle physical and chemical properties [6-9]. The first step to address soiling adequately is monitoring, as soiling mitigation must be tailored to the specific conditions of each PV system, as no universally valid strategy is possible to date. While posteriori solutions do exist, such as PV module cleaning, key questions would be how, when and where should the modules be cleaned. Thus, a priori solution to the soiling issue would be an accurate understanding of the regional dust characteristics to improve the decision-making process for the selection of the best location for a PV plant and/or the best PV technologies to be employed.
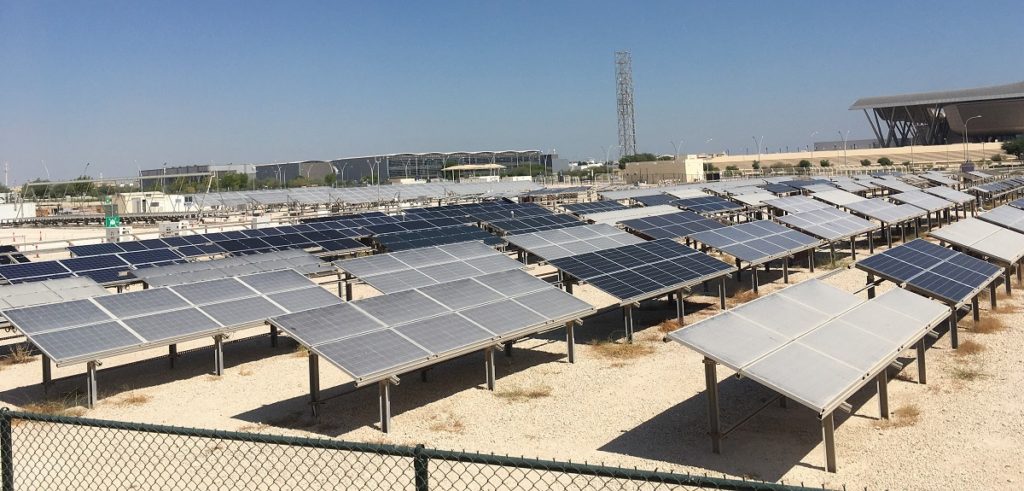
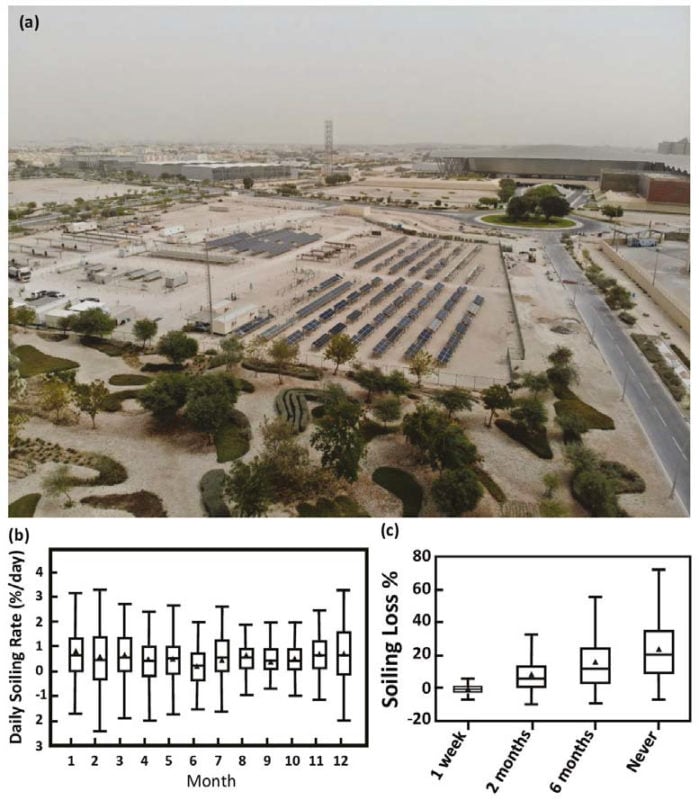
In 2011, the government of Qatar recommended creating a solar energy test station to assess the effect of local climate conditions on PV systems. This aimed to study whether the high temperature, humidity and dust could cause PV reliability risks, which had to be quantified and mitigated prior to the large-scale development of PV plants. In 2012, the Outdoor Test Facility (OTF, Figure 1a) was opened at Qatar Science & Technology Park [10] and is currently operated by Qatar Environment & Energy Research Institute (QEERI).
The OTF is a 35,000m2 outdoor site with various plug and play PV testing that includes more than 85 PV systems from 35 PV manufacturers, 30 PV module test benches, seven tracker HSAT systems, vertical bifacial stands and robotic cleaning. The extreme environmental conditions at OTF (high irradiation, temperature, albedo, soiling, humidity leading to cementation, coastal marine aerosols, etc.) are unique and help to evaluate the performance of different solar technologies and devices and determine how to maximise their energy production and reliability. Since 2013, QEERI has started developing a unique regional and worldwide expertise on PV soiling in desert climates, both from experimental and modelling/forecasting point of view, thanks to OTF unique bench tests [10,11].
At the OTF, the average soiling rate (decrease in daily energy yield due to soiling) for fixed-tilt PV modules is 0.49%/day (Fig.1b), or 13% in an average month without rain or cleaning (Fig.1c). The daily soiling rate was found to be higher in winter due to more frequent overnight dew. Because soiling has a critical impact on PV energy yield in desert climates, a variety of test stands are available at the OTF to study the effects of cleaning frequency, PV cell technology and mounting (fixed tilt versus tracking). Since 2018, OTF houses the Solar Consortium that put together companies, authorities and QEERI to study solar technologies in desert climates by means of a group research project as well as by confidential testing for individual members [10,11].
PV soiling monitoring
The soiling effect on PV power production has a large spatial and temporal variability, both at large and short scales. Soiling may even considerably vary within the radius of a solar power plant and could present large differences in different locations of a country such as Qatar, due to the specific environmental and meteorological conditions.
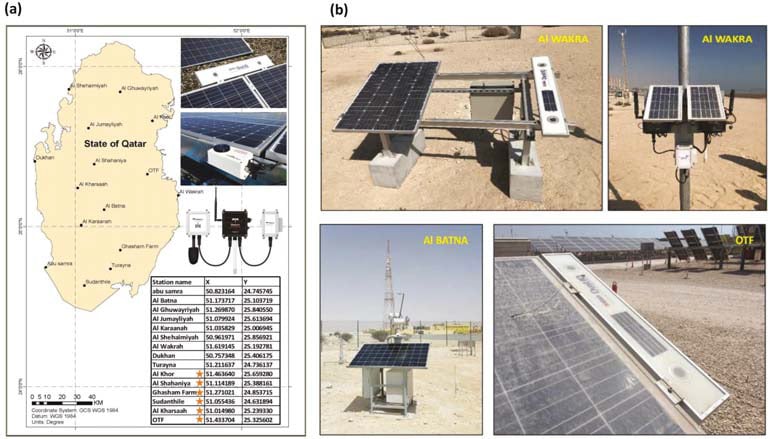
In the quest for soiling monitoring with high accuracy and reliability, QEERI has set the objective of developing a dynamic Dust Atlas mapping for Qatar to help in assessing the actual country’s PV potential, in collaboration with the Qatar Meteorological Department (QMD). Thus, high-quality monitoring stations consisting of 15 Dust IQ sensors and 15 meteorological stations containing air temperature, relative humidity, wind speed and wind direction and pressure, in addition to PM 1, 2.5 and albedometer stations have been deployed at 15 geographical sites selected across Qatar, providing minutes-resolution averages of transmitted data to QEERI servers. All the stations comply with IEC 61724-1 standard [12]. Some sites were additionally equipped with Mars dust sensors [13].
Figure 2 shows the 15 sites of the QEERI National Dust and PV-Soiling Monitoring Network. Photos of the Dust IQ and Mars sensors along with meteorological and PM sensors are shown within the map. All locations were selected to provide a comprehensive coverage of the country, creating a dense network in which the distances between stations are kept under 30km. Thus, a combination of solar, meteorological, environmental and soiling values is used to provide a complete ground calibrated real-time mapping of PV resources, with a high spatial and temporal resolution throughout the country.
Field measurement and PV soiling mapping
PV plant performance can be significantly impacted by module soiling. However, when and where to clean the modules? To answer this question, there is a need for accurate measurements of the soiling on PV modules. Associated with our ongoing efforts in solar forecasting, QEERI is currently developing an operational model to map the soiling appearance in the country and characterise it seasonality and geographically. The ultimate objective is to offer an optimised cleaning schedule and the most efficient method (dry versus wet cleaning) and thus maximise the return on investment on solar power plants.
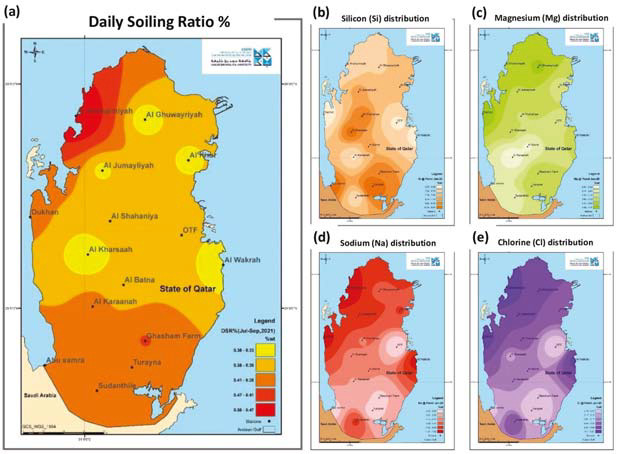
Field measurements of soiling results are shown in Figure 3 in 15 locations spread over the state of Qatar, along with the dominating chemical elements contained in the dust particles. The chemical composition of the dust is of primary importance as not all dusts impact the light attenuation in the same manner. For instance, organic carbon is found to shade light 30 times higher than mineral dust, and elemental carbon (graphite and C60) is over 200 times worse. Moreover, for the same amount of dust, fine particles have a more dramatic effect on light attenuation because of their higher cross-sectional area to volume ratio, that’s why the chemical composition of the dust particles and their shape are critical on the light scattering and absorption properties.
PV soiling mitigation – Robot cleaning
The first MW-scale PV projects in the Arabian Desert were exclusively manually cleaned before brush trolley tractor and manual cleaning Nomadd and Sol-Bright robots were launched, followed by introducing widespread robot cleaning trials with the demonstration of reliability issues [14]. Since 2020, 100-1,000MW PV plants were ~100% cleaned by robots, however many questions remain pending, e.g. the efficiency of these robots in terms of dust removal; cleaning frequency; cleaning uniformity; which type of robots to select; their economics (opex); the impact of weather condition on the process’s efficiency; and more importantly, do cleaning robots abrade modules’ antireflection (AR) coatings, and how might this cleaning process impact PV performance and reliability?[15,16]
QEERI, in collaboration with the Solar Consortium, is leading the largest real-world robot abrasion test globally to study PV module coating abrasion caused by machine cleaning. A commercial automatic PV cleaning machine (“robot”) was installed at the OTF. It is installed on a 50m-long rack with daily and weekly cleaning schedules for different sections. The modules and/or samples are characterised at QEERI. The comprehensive and challenging project studies different types of PV modules, anti-reflecting coating (ARC) and robot technologies. This study will answer key questions such as the rate of ARC abrasion by dry robot cleaning, variation of abrasion between different modules, cleaning frequency versus abrasion and soiling loss and effects of moving shadow.
Bifacial PV modules
A highly interesting soiling mitigation approach in desert environments is the extended use of bifacial PV modules that we are currently experiencing. Bifacial crystalline silicon PV modules can produce additional output energy in comparison to traditional (monofacial) PV modules. This is achieved because both sides of the bifacial PV module, front and rear, can absorb and use solar radiation received by the front side and the light reflected from the ground and surroundings, which reach the rear side of the module.
In this context, the rear side of the bifacial module experiences little or no soiling compared to the front side. The high albedo of desert sand (exceeding 40% in Qatar) in combination with the high levels of solar irradiation, make bifacial modules a very promising alternative technology compared to monofacial for soiling mitigation in a desert environment. It has been proven that bifacial PV modules in combination with one-axis trackers lead to the lowest LCOE [17], becoming the preferred PV configuration in desert climates and especially in the MENA region with the lowest bids as witnessed in the last years.
Furthermore, bifacial PV modules also allow for new and innovative concepts in PV system integration such as the vertically mounted east-west facing bifacial PV installations that benefit from very low soling rates and cleaning cost [18, 19] acting as a passive mitigation approach for soiling [20, 21]. The reduction in the O&M and cleaning cost and the increase in specific energy yield per kW and especially between cleaning cycles make this configuration a promising alternative for soiling mitigation in desert climates.
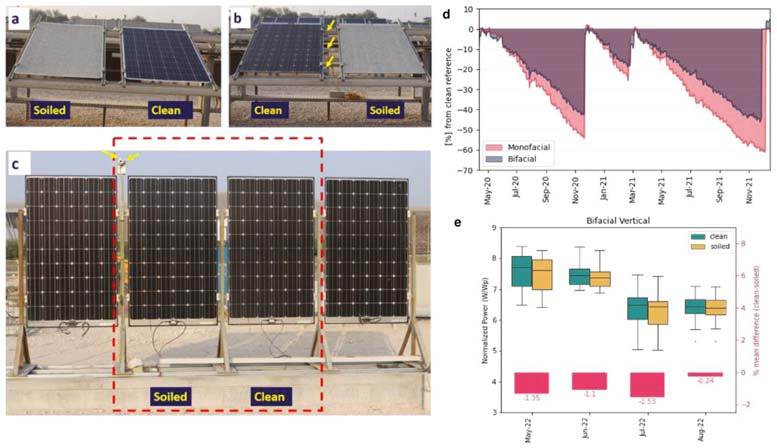
Figure 4 shows an example of a lower effect on energy yield for bifacial modules and low soiling accumulation on vertical PV installations at OTF (figures 4a, b, c). For tilted modules, soiling losses increased with time up to 60% and 45% for monofacial and bifacial modules, respectively, showing the lower effect on energy yield for bifacial (Figure 4d). No significant soiling losses were observed for the vertical module with values <1.5%. On average, vertical module yield is ~10% higher than conventional monofacial tilted module and during the summer, vertical module also strongly outperforms bifacial tilted module. Vertical installation of bifacial modules presents a great opportunity for soiling mitigation and reduction of cleaning costs [22,23].
PV soiling – Forecasting
Additional strategies related to soiling mitigation are to forecast PV performance ratio reduction over several days ahead to permit optimising cleaning schedules. This might be achieved through tracking algorithms developed by machine learning (ML) in combination with meteorological factors. Multi-year monthly soiling maps over Qatar using a frequency map were hence developed.
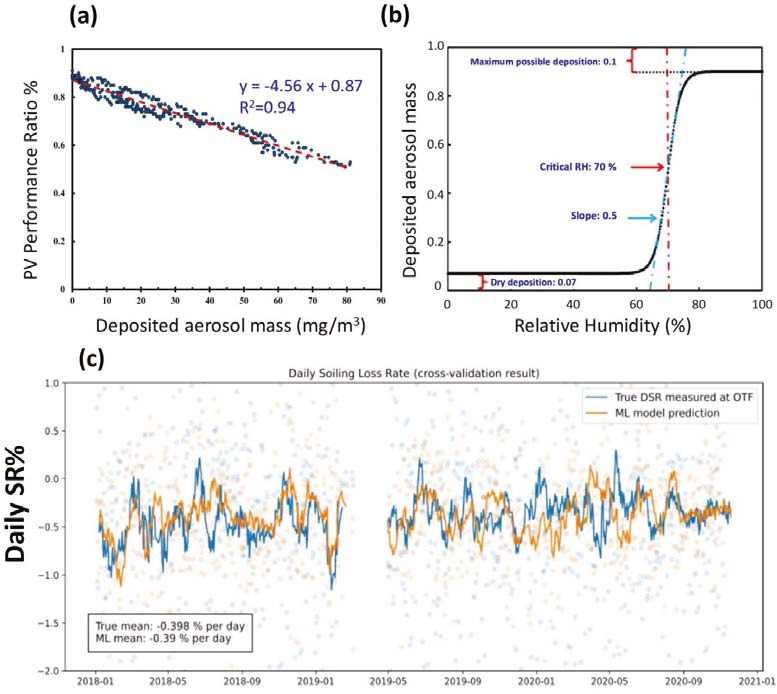
Figure 5a shows the PV performance ratio as a function of deposited aerosol mass at OTF, and the deposited aerosol mass as a function of ambient relative humidity (RH) [24,25]. RH was found to be the critical point above which the deposition/cementation increases exponentially. An empirical model was developed and showed a high correlation between PV soiling loss and the sigmoid function of particulate matter PM10 & RH (Figure 5b). Furthermore, we have used ML to learn the best mapping functions to relate changes in meteorological and environmental conditions with the resulting soiling effect on PV modules. Our input to train the model are historical time series of different meteorological and environmental parameters (temperature, relative humidity, wind speed and direction and PM concentrations) collected in the same OTF location where the soiling effect on PV modules was measured.
We already successfully tested the use of linear and non-linear ML algorithms such as multi-variate linear regression, extreme gradient boosted threes, and artificial neural networks to learn the dependency between the amount of daily soiling and weather and PM conditions. Figure 5c shows an example of the drop in performance ratio measured in the period between January and March 2021.
By taking Qatar as a reference, the local daily loss in performance due to soiling is estimated to be an average of 0.4% per day, matching perfectly the field-measured values and attesting to the efficiency of this developed ML model.
We thus demonstrated that ML is a reliable method to derive the relationship between weather and environmental factors and to predict the corresponding soiling effect.
Conclusions
The light-collecting surfaces of solar power systems cover areas of more than 3,000 km2 worldwide, with PV modules accounting for the majority, and a new terawatt age is definitely established. Due to its large impact on the maintenance and economics of solar energy plants, especially in desert climates, there is growing interest in soiling mitigation, with the publication rate on the topic increasing exponentially since 2008. Currently, there is no ‘one solution fits all’ to the problem of soiling due to its site-specific and seasonal variability. Yet the soiling problem is far from being solved, there are multiple mitigation approaches that have demonstrated their effectiveness, including robotic cleaning, module configuration (HSAT, Bifacial, etc.) and forecasting.
References
[1] SolarPower Europe: Global Market Outlook for Solar Power 2022-2026, in, 2022.
[2] K. Ilse, L. Micheli, B. W. Figgis, K. Lange, D. Daßler, H. Hanifi, F. Wolfertstetter, V. Naumann, Ch. Hagendorf, R. G., J. Bagdahn, Techno-Economic Assessment of Soiling Losses and Mitigation Strategies for Solar Power Generation, Joule, 3, 2019, 2303-2321, https://doi.org/10.1016/j.joule.2019.08.019.
[3] A. Sayyah, M. Horenstein, and M. Mazumder, “Yield loss of photovoltaic panels caused by depositions”, Solar Energy 107, 576-604, 2014, http://dx.doi.org/10.1016/j.solener.2014.05.030
[4] M. Maghami et al., “Power loss due to soiling on solar panel”, Renewable and Sustainable Energy Reviews 59, 1307-1316, 2016.
[5] Betak, J., Súri, M., Cebecauer, T., Skoczek, A., 2012. Solar resource and photovoltaic electricity potential in EU-MENA region. In: Proceedings of the 27th European Photovoltaic Solar Energy Conference and Exhibition, pp. 2–5.
[6] Figgis, B., Ennaoui, A., Ahzi, S. & Rémond, Y. Review of PV soiling particle mechanics in desert environments. Renew. Sustain. Energy Rev. 76, 872–881, 2017.
[7] Ilse, K., Figgis, B., Naumann, V., Hagendorf, C. & Bagdahn, J. Fundamentals of soiling processes on photovoltaic modules. Renew. Sustain. Energy Rev. 98, 239–254, 2018.
[8] B. Figgis, A Nouviaire, Y Wubulikasimu, W Javed, B Guo, A Ait-Mokhtar, et al. “Investigation of factors affecting condensation on soiled PV modules” Solar Energy 159, 488-50, 2018.
[9] W. Javed, B. Guo, B. Figgis, B. Aïssa “Dust potency in the context of solar photovoltaic (PV) soiling loss” Solar Energy 220, 1040-1052, 2021.
[10] B. Figgis “QEERI Outdoor Test Facility Technical Details” DOI: 10.13140/RG.2.2.29594.98244. Document available at: file:///C:/Users/baissa/Downloads/QEERIOTFTechnicalDetailsv2021-03.pdf
[11] Figgis, B. QEERI Solar Test Facility 5-Year Report, March 2018. DOI: 10.13140/RG.2.2.12062.23361
[12] “Photovoltaic system performance – part 1: monitoring,” IEC standard 61724-1, 2017.
[13] B. Aïssa, G. Scabbia, B. W. Figgis, J. Garcia Lopez, V. Bermudez Benito “PV-Soiling Field-Assessment of Mars™ Optical Sensor Operating in the Harsh Desert Environment of the State of Qatar” Solar Energy 239,139-146, 2022, https://doi.org/10.1016/j.solener.2022.04.064.
[14] S. Fan, W. Liang, G. Wang, Y. Zhang, Sh. Cao, A novel water-free cleaning robot for dust removal from distributed photovoltaic (PV) in water-scarce areas. Solar Energy 241, 553-563, 2022, https://doi.org/10.1016/j.solener.2022.06.024
[15] M. K. Ghodki, An infrared based dust mitigation system operated by the robotic arm for performance improvement of the solar panel, Solar Energy 244, 343-361, 2022, https://doi.org/10.1016/j.solener.2022.08.064
[16] B. Figgis, V. Bermudez, PV coating abrasion by cleaning machines in desert environments – measurement techniques and test conditions, Sol. Energy, 225, 252-258, 2021.
[17] C.D. Rodríguez-Gallegos, H. Liu, O. Gandhi, J.P. Singh, V. Krishnamurthy, A. Kumar, J.S. Stein, S. Wang, L. Li, T. Reindl, I.M. Peters, Global Techno-Economic Performance of Bifacial and Tracking Photovoltaic Systems, Joule, 4 (2020) 1514-1541.
[18] M.R. Khan, A. Hanna, X. Sun, M.A. Alam, Vertical bifacial solar farms: Physics, design, and global optimization, Appl. Energy, 206 (2017) 240-248.
[19] L. Bodlak, H. Hernandez, J. Bierbaum, J. Kang, S. Nold, R. Preu, Price-bifaciality relationship of bifacial modules in vertical eastwest oriented PV systems, in: 35th European Photovoltaic Solar Energy Conference and Exhibition, Brussels, Belgium, 2018, pp. 2134-3127.
[20] E. Cabrera, F. Araya, A. Schneider, A. Marzo, R. Roescu, J. Rabanal, P. Ferrada, P. Ayala, D. Berrian, J. Libal, E. Fuentealba, R. Kopecek, AtaMoS TeC Project: Soiling Impact on Bifacial Modules with Different Mounting Geometry in the Atacama Desert in Chile, in: 7th IEEE World Conference on Photovoltaic Energy Conversion, WCPEC 2018, Institute of Electrical and Electronics Engineers Inc., 2018, pp. 3653-3659.
[21] E.G. Luque, F. Antonanzas-Torres, R. Escobar, Effect of soiling in bifacial PV modules and cleaning schedule optimization, Energy Convers. Manage., 174 (2018) 615-625.
[22] N. Riedel-Lyngskær, M. Ribaconka, M. Pó, A. Thorseth, S. Thorsteinsson, C. Dam-Hansen, M. L. Jakobsen, The effect of spectral albedo in bifacial photovoltaic performance, Solar Energy, 231, 921-935, 2022, https://doi.org/10.1016/j.solener.2021.12.023.
[23] C. D. Rodríguez-Gallegos, H. Liu, O. Gandhi, J. P. Singh, V. Krishnamurthy, A. Kumar, et al., “Global Techno-Economic Performance of Bifacial and Tracking Photovoltaic Systems,” Joule 4, 1514-1541, 2020.
[24] C. Fountoukis, L. Ackermann, M.A. Ayoub, I. Gladich, R.D. Hoehn, A. Skillern, Impact of atmospheric dust emission schemes on dust production and concentration over the Arabian Peninsula. Model Earth Syst Environ. 2: 115, 2016, doi:10.1007/s40808-016-0181-z.
[25] C. Fountoukis, B. Figgis, M.A. Ayoub and L. Ackermann, Effects of atmospheric dust deposition on solar PV energy production in a desert environment, Solar Energy, 164, 94–100, 2018.


