
Even if you've been living under a rock all your life, I can bet that you would have heard of the dramatic decline in the PV module prices in recent years. Conventional wisdom has it that the price will continue to fall for many years to come.
Nevertheless, how far (and how fast) will the solar PV price continue to drop? This is an entirely different question – it has captivated the PV industry, energy sectors and policy makers for the past decade. This has become an increasingly pressing issue in the era of post-subsidy, coupling with a mounting global challenge in the fight against climate change.
Try Premium for just $1
- Full premium access for the first month at only $1
- Converts to an annual rate after 30 days unless cancelled
- Cancel anytime during the trial period
Premium Benefits
- Expert industry analysis and interviews
- Digital access to PV Tech Power journal
- Exclusive event discounts
Or get the full Premium subscription right away
Or continue reading this article for free
What if the future PV prices could be boiled down to this one simple, rather beautiful, equation?
P =0.119048720990208+0.930860320330261x−0.000108888719476707y−0.00922272573929036z
P= Predicted future PV Module price in 3 months time
x= Current PV module price
y=Current silver price
z=Silicon price 2 months ago
I recently proposed and supervised a Master Degree project at Cambridge University, Engineering Department. The goal was to try to understand precisely this question in the hope of working out a simple equation. The research project was carried out by Cam Hardman – a smart chap whom was sceptical of the outcome in the first place, and quite rightly so.
The project began with asking what factors were affecting the price and could they be quantified in a meaningful way? After extensive and intensive background research, the following potential factors (the usual suspects) were identified:
- Raw material costs – silicon and silver prices
- Market demand and supply
- Economic Policy Uncertainty – Global, European and UK contexts
- MIP factors
- Feed in Tariff and the volume of PV installations
- Exchange rates
A correlation analysis was first conducted to study the relative correlation of the above factors against historical PV prices. This was to provide a guidance on the significance of each factor and to predict the success of the subsequent regression analysis. Not surprisingly, the silicon price played a major role while the European economic uncertainty had a weak correlation.
The next step was to carry out regression analysis on a multiple basis – the results from the first iteration suggested that all of the economic policy uncertainty indices could be accounted for by random fluctuations. These factors were discharged in the first round; multiple regression analyses were repeated until the figures were gradually stabilised with a high level of confidence. Three remaining strong factors were module, silicon and silver prices. Although the coefficient of determination (R Squared) was reasonably good at this point, the actual modelled graph price was less than acceptable.
It transpired that for the prediction to be accurate, time delay in material costs ought to be taken into consideration. In other words, it would take a certain amount of time for the raw material costs to be reflected on the actual module cost simply through normal supply chain cycle. Another multiple regression analyses were carried out with time delays in raw material costs. The analytical results indicated that the sensible choices would be three-months-old silver price and five-months-old silicon price, which were not unrealistic from a practical point of view.
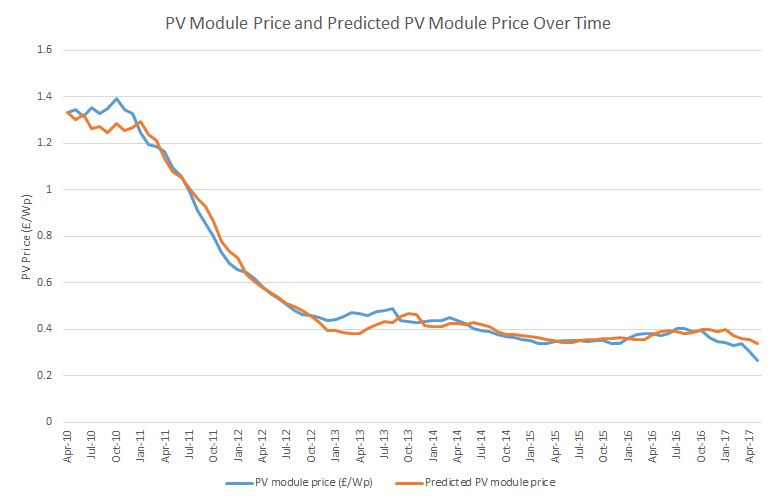
After the time delay was taken into account, lo and behold, it ended up with the simple equation at the beginning of this article. Using this equation to plot against historical PV prices results in the following graph, it correctly describes 98.5% of the historical prices in the dataset. Being a perfectionist who refuses to accept anything less than 100% – why are there some discrepancies between the predicted and the actual price, notably during Q1 to Q2 2013 and Q4 2016 to Q2 2017?
Going through the dataset, it revealed that they were caused by the currency exchange and overcapacity. For the former, the rise in price was caused by a weakened pound against the euro during this time. The price of PV modules in euros continued to decline but the weakened pound caused an increase in the price observed in the UK. For the latter, it was caused by a sudden dip in the PV module price due to overcapacity – the equation was unable to take into account the effect of unsold stock. In both cases, the equation was using data which had been backdated by three months and so it took a little time to adjust to the uncharacteristic change in trend.
Looking at the above graph, one may argue that a good mathematician can always formulate an equation to match any trend, especially historical ones. But don’t push your luck by trying to use it to predict the future. Andrew Lang, the Scottish poet, once said “An unsophisticated forecaster uses statistics as a drunken man uses lamp-posts – for support rather than for illumination”.
Will the equation really work for predicting the future price? The proof of the pudding is in the eating – try it out and you will find out in three months time. Assuming that it is not dead in the water straight away, the next step is to systematically map the future trend and verify the validity of the equation. One area of interest is to tackle the uncharacteristic change in trend, which by definition, unpredictable. With that in mind, it is unlikely that the research will end up with a perfect forecast. The future work, however, may result in an equation that hints at the direction of travel in this volatile market.
One thing is for sure – the continued improvement to costs has made solar PV a serious challenge to the fossil energy industry. On the utility scale, its LCOE has improved tremendously over the last few years such that it has become a truly sustainable solution in both a financial and an energy sense. For the residential sector, solar PV, especially roof-integrated systems like Clearline Fusion, has become a de facto solution to the new build sector in meeting energy requirements. This one, you don’t need a crystal ball nor a fancy equation to predict.
Dr KT Tan is the Technical Director at Viridian Solar – a UK company based in Cambridge with their renowned innovative Clearline Fusion. He has been devoting his professional life for over a decade to developing products and technologies for the renewable sector. He started to work with solar thermal well before the PV became a mainstream renewable solution. He now focuses on solar PV with a particular interest in roof-integrated systems, advanced cell technologies and innovative mounting solutions.


")


