April 2026 delivered a continuation of Australia’s seasonal solar contraction as the National Electricity Market (NEM) moved deeper into autumn, with combined utility-scale and rooftop generation declining 10.9% month-on-month to 3,856GWh from March’s 4,332GWh.
The month’s performance accentuated the ongoing impact of reduced daylight hours and lower solar irradiance, while pricing dynamics revealed further stabilisation following the extreme volatility witnessed earlier in the year.
Try Premium for just $1
- Full premium access for the first month at only $1
- Converts to an annual rate after 30 days unless cancelled
- Cancel anytime during the trial period
Premium Benefits
- Expert industry analysis and interviews
- Digital access to PV Tech Power journal
- Exclusive event discounts
Or get the full Premium subscription right away
Or continue reading this article for free
Analysis of data sourced from Open Electricity (formerly OpenNEM) shows that April’s combined solar output represented a 12.1% increase from the previous autumn period, increasing from April 2025’s 3,440GWh.
However, this year-on-year comparison masks divergent trajectories between the two segments, with utility-scale installations demonstrating stronger growth while rooftop solar expansion moderated.
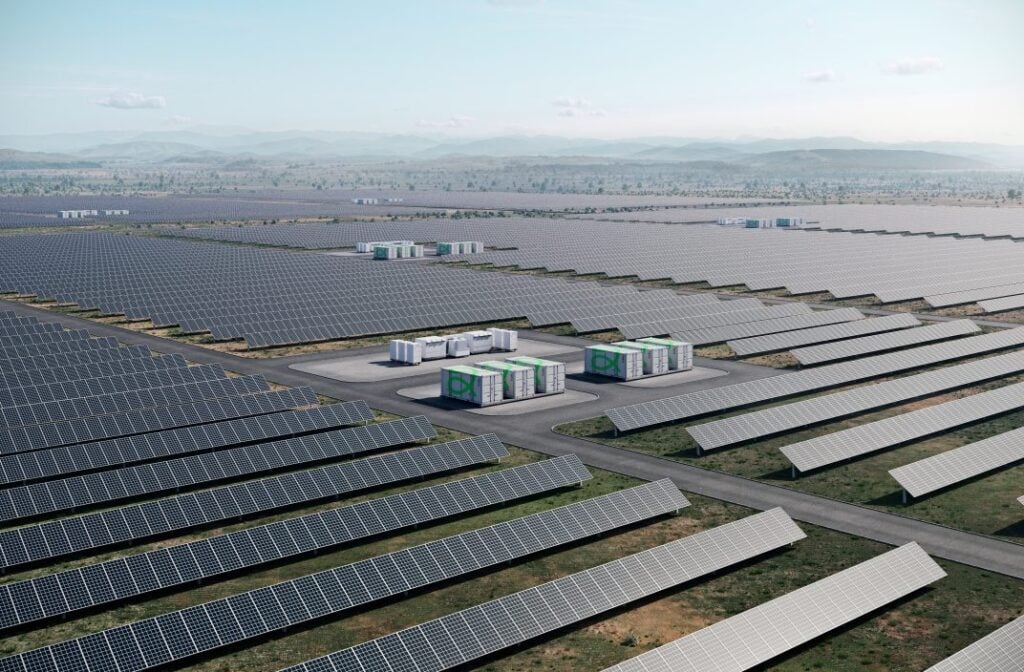
The month’s generation patterns occurred against a backdrop of ongoing grid transformation, as battery storage systems increasingly shift solar generation from midday to evening peak demand periods.
This operational shift continues to reshape the value proposition for solar assets, particularly as regulatory frameworks evolve to address curtailment challenges facing distributed generation during periods of oversupply.
Utility-scale maintains momentum as rooftop growth slows
Utility-scale solar generated 1,693GWh in April 2026, representing a 4.5% decrease from March’s 1,773GWh.
This decline extended the seasonal contraction that began following January’s record 2,234GWh output, with April’s generation falling 24.2% from that summer peak.
Despite the month-on-month reduction, the segment achieved a 20.8% year-on-year increase from April 2025’s 1,402GWh, demonstrating the impact of capacity additions over the past twelve months.
Daily utility-scale generation ranged from 41GWh on 12 April to 64GWh on both 2 April and 20 April, representing a 56.1% spread. This volatility was lower than March’s 82.5% spread, suggesting more consistent weather conditions throughout the month.
The segment achieved output above 60GWh on nine days, concentrated primarily in the first three weeks of April before declining toward month-end.
Rooftop solar generated 2,163GWh in April 2026, marking a 15.5% decrease from March’s 2,559GWh and representing the steepest month-on-month decline since the summer peak.
This output was 6.1% higher than April 2025’s 2,038GWh, indicating continued but moderating growth in distributed capacity.
The year-on-year increase of 6.1% represented a deceleration from the double-digit growth rates observed in previous months, potentially reflecting saturation in key metropolitan markets or reduced installation rates following the summer construction season.
Daily rooftop generation spanned from 59GWh on 30 April to 92GWh on 2 April, representing a 55.9% spread. This marked a substantial reduction from March’s 145.2% spread, indicating more stable generation conditions across the distributed network.
The segment-maintained output above 75GWh on seventeen days throughout April, with the highest generation concentrated in the first half of the month before declining as autumn progressed.
The generation balance between segments continued to shift in April 2026. Utility-scale solar accounted for 43.9% of total solar output, compared to rooftop solar’s 56.1%, representing a 1.28:1 ratio.
This marked a further narrowing from March’s 1.44:1, February’s 1.47:1, and January’s 1.55:1, establishing a clear trend toward greater parity between the two segments.
The continued convergence reflects utility-scale solar’s more stable generation profile during seasonal transitions, while rooftop installations experience proportionally greater impacts from reduced irradiance and shorter daylight hours.
The highest combined solar output occurred on 2 April, when utility-scale and rooftop solar together generated 156GWh. This fell short of March’s peak of 169GWh and represented a 29.7% decline from January’s record daily output of 222GWh.
Conversely, the lowest combined output was recorded on 30 April, when utility-scale solar generated 54GWh and rooftop solar produced 59GWh, totaling 113GWh.
This minimum exceeded March’s lowest combined output of 85GWh, suggesting that while overall generation declined, the floor remained higher than the previous month’s weakest performance.
Pricing environment stabilises with reduced negative events
April 2026’s pricing environment delivered further stabilisation following the extreme volatility that characterised the first quarter of the year.
Utility-scale solar prices ranged from AU$-4.37/MWh (US$-2.99/MWh) on 12 April to AU$43.98/MWh on 1 April, representing a range of AU$48.35/MWh. This marked a substantial reduction from March’s AU$112.16/MWh range and February’s AU$208.27/MWh range, indicating a return to more typical market conditions.
The segment experienced only one negative pricing event in April, on 12 April, when prices fell to AU$-4.37/MWh. This represented a reduction from March’s single negative event and a dramatic improvement from February’s multiple extreme negative pricing episodes.
The isolated nature of April’s negative pricing suggests that oversupply conditions were less severe than in previous months, potentially reflecting improved demand-supply balance as autumn cooling reduced air conditioning loads while solar generation also declined.
Rooftop solar faced a slightly more volatile pricing environment, with prices spanning from AU$-11.78/MWh on 4 April to AU$47.37/MWh on 1 April, representing a range of AU$59.15/MWh. While this exceeded utility-scale solar’s range, it was a substantial improvement over March’s AU$116.36/MWh and February’s unprecedented AU$457.03/MWh.
Rooftop solar experienced negative pricing on four occasions during April: 4 April (AU$-11.78/MWh), 12 April (AU$-6.74/MWh) and 25 April (AU$-7.50/MWh). These events occurred during periods when distributed generation exceeded instantaneous demand, particularly during mild autumn days when solar output remained robust while electricity consumption declined from summer peaks.
The frequency of negative pricing events matched March’s four occurrences, suggesting a stabilisation in oversupply dynamics.
The highest prices for both segments occurred on 1 April, when utility-scale solar reached AU$43.98/MWh and rooftop solar achieved AU$47.37/MWh. This pricing convergence, with rooftop solar commanding a modest premium, contrasted with the more dramatic price divergences observed in previous months.
The correlation between pricing peaks and the month’s highest combined generation output of 156GWh suggests that strong solar availability did not suppress prices on this occasion, potentially reflecting elevated demand or reduced availability from other generation sources.
The 4.6% decline in combined solar generation from March to April extends the seasonal contraction that began following January’s record output, with April’s 3,856GWh representing a 32.3% decrease from the summer peak.
However, the 12.1% year-on-year increase from April 2025 confirms that capacity expansion continues to drive long-term generation growth despite seasonal constraints.
You can explore previous solar generation performance in our NEM Data Spotlight series, with all entries available to PV Tech Premium subscribers.


