Europe saw extreme weather throughout summer, from heatwaves and wildfires to a solar eclipse. Solargis industrial engineer and technical consultant Pablo Caballero discusses how asset owners and operators should respond to these extreme events and the value of high-quality data collection in making these decisions.
Solar projects are built for long-term operating lifetimes. Over 25 or 30 years, a typical PV power plant could endure heatwaves, unusually cloudy periods, high aerosol events caused by large wild res, volcanic eruptions or desert dust storms, drought, intense rainfall and, occasionally, even astronomical events such as solar eclipses.
Try Premium for just $1
- Full premium access for the first month at only $1
- Converts to an annual rate after 30 days unless cancelled
- Cancel anytime during the trial period
Premium Benefits
- Expert industry analysis and interviews
- Digital access to PV Tech Power journal
- Exclusive event discounts
Or get the full Premium subscription right away
Or continue reading this article for free
Understanding these phenomena correctly is essential, particularly now that the extreme weather happens more often. A weather anomaly that might once have been treated as an interesting exception can now affect performance reporting, revenue expectations, market exposure, storage operation and investor confidence.
The June-July-August 2026 season was a useful reminder of this.
The summer brought strong regional contrasts in solar irradiation, temperature and precipitation. Some regions experienced exceptionally sunny and hot conditions. Others recorded significant irradiation deficits linked to persistent cloudiness, intensified monsoon activity or unusual precipitation patterns.
For PV project owners, it is not enough to know that production was above or below expectation. The important question is why.
El Niño as an important background signal
El Niño affects atmospheric circulation, cloudiness, precipitation and temperature patterns across large parts of the world. Its influence is not uniform, and regional responses can differ significantly. In some regions, El Niño may contribute to clearer skies and higher irradiation. In others, it may bring increased cloudiness, precipitation or more variable conditions.
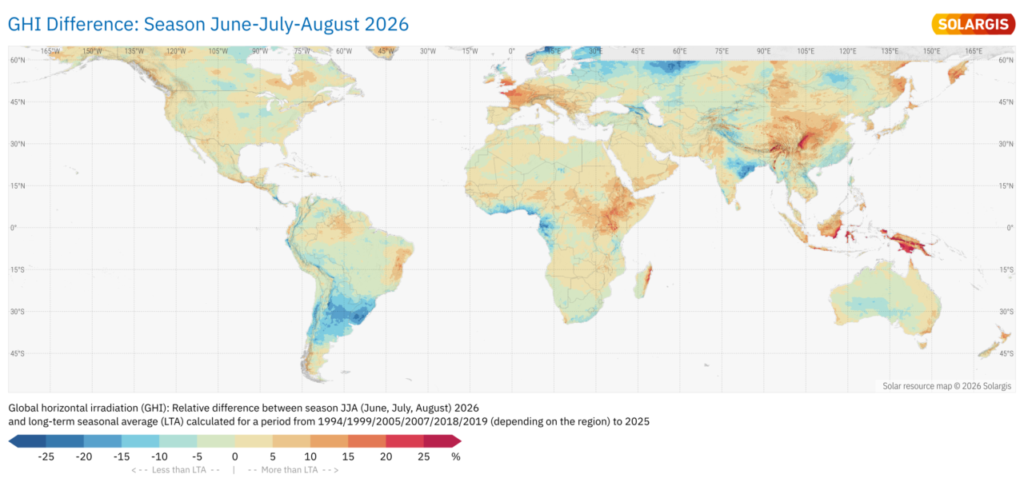
This was visible during summer 2026. The spatial contrasts in global horizontal irradiation (GHI) and precipitation across the Pacific region, South America, Papua, Indonesia and parts of east Asia were consistent with the influence of evolving El Niño conditions.
For solar generation, this has two implications.
First, climate oscillations such as El Niño can affect short-term production. Monthly and seasonal anomalies can shift asset performance above or below expectations, depending on the location. A project owner may experience an excellent production month in one market and a disappointing season in another, even though both are linked to the same broader climate pattern.
Second, they can affect how we think about long-term expectations. A strong or rapidly developing climate oscillation does not automatically invalidate a long term energy yield assessment. Long-term assessments are built to account for natural climate variability. But if a season is highly unusual, it becomes important to understand where it sits within the long term distribution and whether recent observations suggest that assumptions should be reviewed.
Project owners should therefore treat natural phenomena like El Niño not as simple explanations, but as signals that need to be interpreted through high resolution, site-specific data.
Heatwaves: more sunlight does not always mean more output
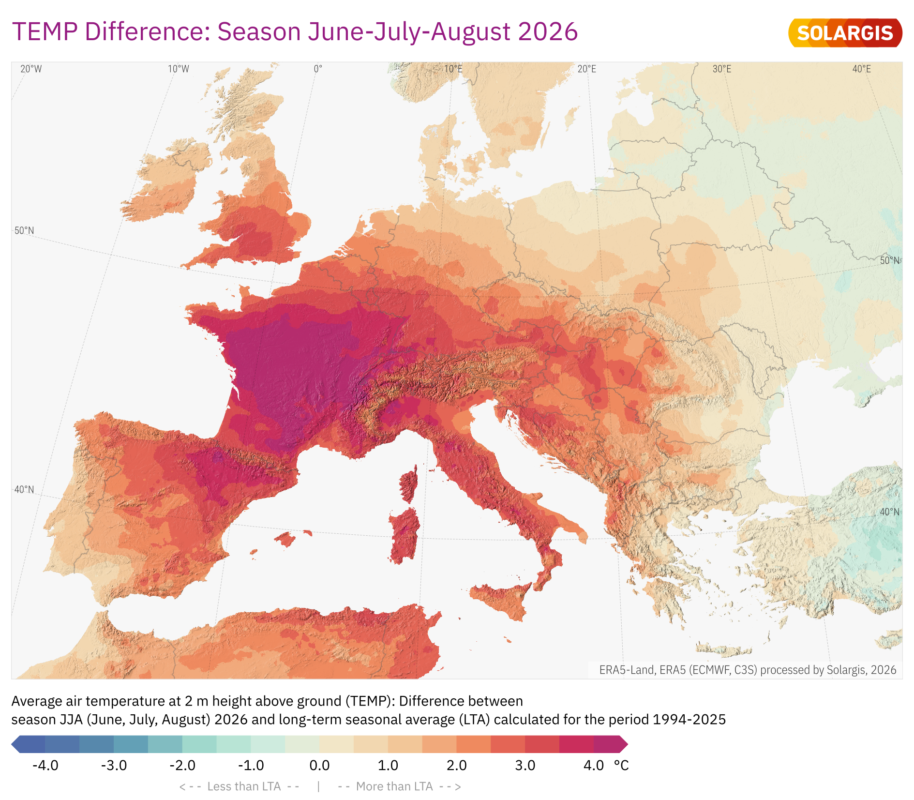
This is one of the most important lessons from summer 2026. In much of western and central Europe, July brought exceptional irradiation together with very high temperatures and prolonged dry conditions. According to Solargis’ June-July-August analysis, southern England, Wales and Normandy recorded GHI anomalies exceeding +20%, while much of central Europe and the Balkans saw above-average irradiation in the range of +5% to +15%.
For PV power plants, this created a mixed performance picture.
On the one hand, clearer skies increased the solar energy available at the surface. On the other hand, high temperatures reduced module efficiency. Crystalline silicon modules lose output as cell temperature rises above standard test conditions. Cell temperature itself depends on air temperature, irradiance, wind speed, mounting structure and local site conditions.
During heatwaves, PV plants may therefore produce strongly, but still underperform relative to the expected yield under the actual conditions. This distinction is important.
A power plant owner looking only at total energy generation may conclude that performance was good because production was high. But if irradiance was exceptionally high, the plant may still have produced less than it should have under the actual conditions. Conversely, a plant may appear to underperform against a long-term monthly budget, while in reality it performed correctly under a period of reduced resource.
High temperatures also affect equipment beyond the PV modules. Inverters can reduce output when internal or ambient temperatures exceed safe operating thresholds. This thermal derating protects equipment but reduces energy production. Transformer and cable losses also increase with temperature. In regions where grids are under pressure, high solar production during midday can also coincide with curtailment or market-related dispatch limitations.
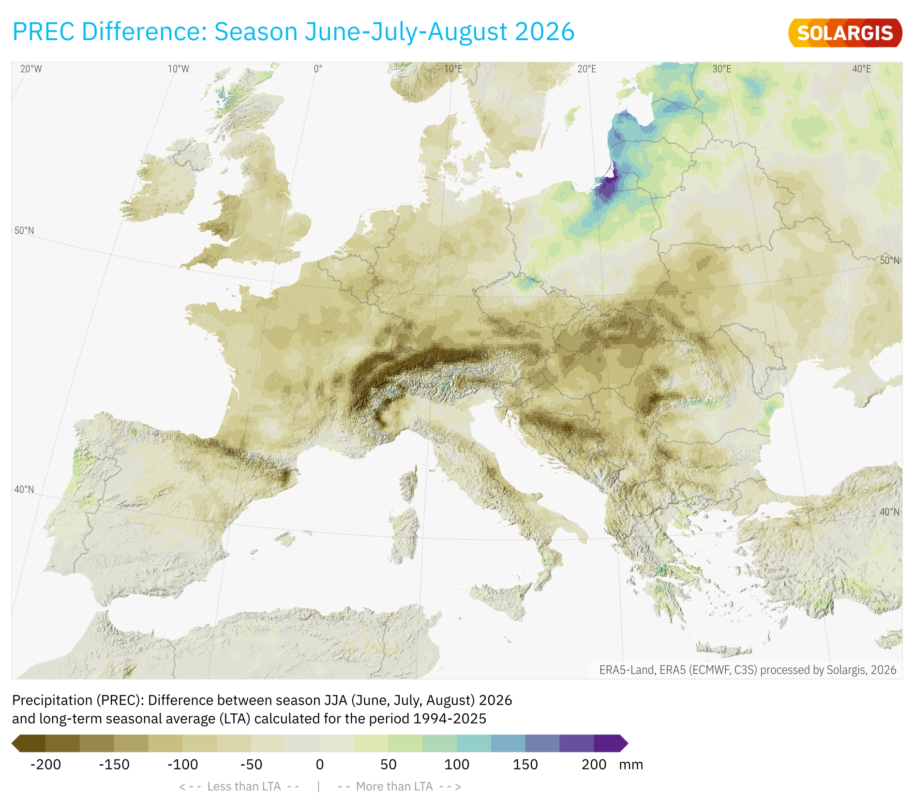
The combination of heat and precipitation deficits is especially important. In the June-July-August season, many regions across western and central Europe recorded seasonal precipitation 50% below normal, with local deficits reaching as much as 80%.
In central Europe, the persistent lack of rainfall reinforced already dry soil and vegetation conditions. Together with above average temperatures and high solar irradiation, this dryness intensified heat stress and contributed to elevated wildfire risk.
This is why performance analysis during heatwaves requires more than a comparison between actual production and expected production. It needs temperature, wind, irradiance, soiling context, equipment status and grid information. Without these inputs, the explanation remains incomplete.
Wildfires’ impact can travel far beyond the flames
In Europe, the 2026 summer season was also marked by severe wildfire activity. In France, for example, more than 70,000 hectares burned in July, marking the country’s largest wildfire season since 1949.
The direct impact of fire on PV assets can be severe, but relatively local. The wider performance issue is often smoke. Smoke plumes can travel long distances. A PV plant does not need to be located near a fire to experience its effect. If smoke passes overhead, it can reduce the irradiance reaching the surface and create short-term deviations from expected output.
This effect can be tracked using aerosol information, particularly Aerosol Optical Depth (AOD). Under clear-sky conditions, a rise in aerosol loading often appears as a reduction in direct normal irradiance, even when cloud cover is limited or absent.
Although the presence of aerosols coming from Sahara deserts can be quite common in Southern Europe during summer, an AOD map for the sample site near Soria, Spain, at 670nm on 22 July 2026, shows a highly localised plume covering the surrounding area, very likely connected to the active wild fire in Guadalajara.
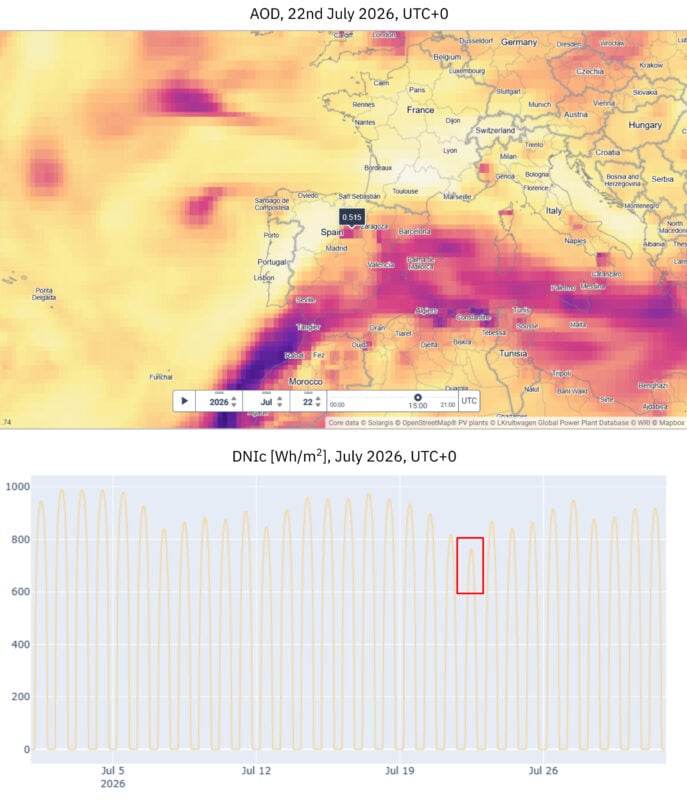
This distinction matters because smoke related losses can easily be misinterpreted.
If an asset manager sees a production drop on an apparently clear day, the first assumption may be an operational issue, soiling, inverter behaviour or a sensor problem. But if aerosol data shows a smoke plume passing over the site, part of the explanation may be resource-driven.
Wild res can also increase soiling. Ash and fine particles may settle on PV modules and on-site sensors. This creates a second challenge. If the pyranometer is soiled, it may report lower irradiance than actually available to a clean reference surface. In that case, the site sensor itself becomes part of the problem, not a fully reliable benchmark.
This is one reason why independent irradiance and meteorological data are valuable during extreme events. On-site sensors are important, but they require maintenance, quality control and interpretation. Satellite-based and reanalysis data provide an external reference that can help identify whether a deviation was caused by the resource, the plant or the measurement system.
The solar eclipse: predictable does not mean irrelevant
The total solar eclipse of 12 August 2026 was different from heatwaves and wildfires. It was not a meteorological event, and it was fully predictable. Its timing, location and effect on irradiance could be calculated years in advance.
For PV plants in Spain, it was particularly relevant because of the country’s high solar penetration. The path of totality crossed northern mainland Spain and extended toward the Balearic Islands. Other parts of Europe experienced the event as a partial eclipse.

Because the eclipse occurred close to sunset in Spain, the total energy loss was limited compared with an eclipse occurring near solar noon. However, from a performance reporting perspective, events such as solar eclipses still matter. They create a smooth and predictable dip in irradiance that needs to be attributed properly. Otherwise, they may appear as an unexplained deviation, an operational fault or a mismatch between measured and expected production.
This is a useful example of a wider principle. Not all unusual events are uncertain. Some can be predicted very precisely. But they still need to be included in the reporting chain.
What happens when July is extreme and August is closer to normal?
For long-term asset owners, one of the most important questions is how to interpret an extreme month within a longer season. A very sunny month can compensate for a cloudier one. Cooler periods can reduce thermal losses after a heatwave. Rainfall can reduce soiling after a dry spell.
But this does not mean that the extremes are irrelevant. Monthly or seasonal averages can hide important operational and financial signals.
A project may appear to be on track annually, while still experiencing specific losses during high-value periods. A production deficit during a high-price evening ramp, an intraday trading window or a grid-constrained period may have a larger financial impact than the same energy loss at another time.
This is particularly important as more PV projects are exposed to merchant pricing, curtailment, balancing markets and storage optimisation. The value of solar energy increasingly depends not only on how much is produced, but when it is produced and how predictable that production is. In this environment, extreme weather is not only a generation issue. It is a revenue and risk management issue.
Expected production has more than one meaning
Every performance report starts with a comparison between measured production and expected production. When the numbers are close, few questions are asked. When there is a gap, stakeholders need an explanation.
For investors and lenders, expected production often refers to the long-term P50 or another Pxx value used at financial close. Their question is: are we on track against the investment case?
For asset managers and performance engineers, expected production should also be recalculated for the specific reporting period using actual weather and resource conditions. Their question is: given the irradiance, temperature, wind, aerosols, precipitation and grid constraints that occurred this month, did the plant perform as it should?
Both perspectives are valid. But they require different benchmarks.
A power plant can be below its long term budget because the month was cloudier than normal, while still performing correctly under actual conditions. A plant can exceed budget because the resource was unusually strong, while still underperforming technically. Without separating these effects, the report can be misleading.
This is why performance assessment needs to distinguish between resource driven, plant-driven and grid-driven effects.
Resource-driven effects include irradiance, temperature, wind, aerosols, precipitation, snow and events such as eclipses. Plant-driven effects include availability, degradation, soiling, inverter behaviour, clipping and equipment losses. Grid-driven effects include curtailment, congestion, dispatch limitations and market-related constraints. Only when these categories are separated can project owners understand what really happened.
Data resolution matters more than before
Summer 2026 also showed why data quality, resolution and independence matter in PV performance assessment.
Monthly data can show whether a season was above or below normal. Daily data can identify heatwaves, cloudy periods or wildfire-related events. But hourly and sub-hourly data are needed to understand short-term ramps, inverter response, storage behaviour and intra day market exposure.
Extreme weather also tests the reliability of measurement systems. During heatwaves, wildfires, dust events or soiling episodes, on-site sensors may be affected by dirt, local exposure issues, communication failures or delayed maintenance. This does not reduce the value of ground measurements, but it reinforces the need for quality control and independent comparison.
Satellite-based irradiance data, reanalysis meteorological data and aerosol models provide a consistent external reference. They help asset owners understand whether a production deviation was local or regional, whether neighbouring assets experienced similar conditions and whether the likely cause was irradiance, temperature, aerosols, wind, precipitation, plant behaviour or measurement issues.
As PV penetration increases, the industry needs to move beyond annual and monthly averages toward higher resolution monitoring, simulation, forecasting and independent performance assessment.
From performance reporting to active risk management
As solar becomes a larger part of the power system, owners need performance intelligence that is more continuous, more granular and more closely connected to commercial decision-making.
Long-term resource data is still essential for project finance. But during operations, owners also need updated resource assessments, independent performance benchmarks, short-term forecasts and tools that can identify the reason behind deviations.
This is particularly important in a year influenced by El Niño. Climate patterns may increase the likelihood of certain regional anomalies, but they do not remove the need for local analysis. A project owner needs to know what happened at the site, how unusual it was, whether it affected the PV plant’s performance and whether similar conditions may continue.
In this sense, solar resource intelligence is becoming part of active asset management.
What project owners should take from summer 2026
The main lesson from summer 2026 is not that PV plants are unprepared for extreme weather. Most modern assets are designed to operate through heatwaves, smoke events, storms and short-term irradiance dips.
The real lesson is that performance reporting and decision-making need to become more precise. Asset owners need to understand whether a production gap was caused by resource variability, plant behaviour, grid constraints, or measurement issues. They also need to know whether an extreme month was an isolated event or part of a broader seasonal pattern.
This understanding must then trans late into practical decisions: investor reporting, model updates, maintenance planning, forecasting, battery operation and financial risk management.
Extreme weather and climate variability will remain part of solar generation. The goal is not to treat every anomaly as a crisis, but to make anomalies explainable.
With high-resolution irradiance data, reliable meteorological inputs, aerosol information, validated models, independent performance benchmarks and accurate forecasting, unusual events can be understood in context. Solar generation will always depend on the weather. But the quality of decisions around solar assets depends on how well we understand it.
Author
Pablo Caballero is an industrial engineer with extensive experience in the renewable energy and software development sectors. He specialises in technical writing and is driven by a passion for bridging gaps between audiences, technology and business. With a diverse background, he is dedicated to promoting sustainability ideas and education in STEM fields.